- Intro
- Training Videos
- Learn To Trade
- ZenBot Scanner Basics (Start Here)
- Stock Scans
- Scan Results
- Filters
- Custom Scans
- Sector Strength and Scans
- Market News
- Price Pops
- Launch Charts in Your Charting App
Intro
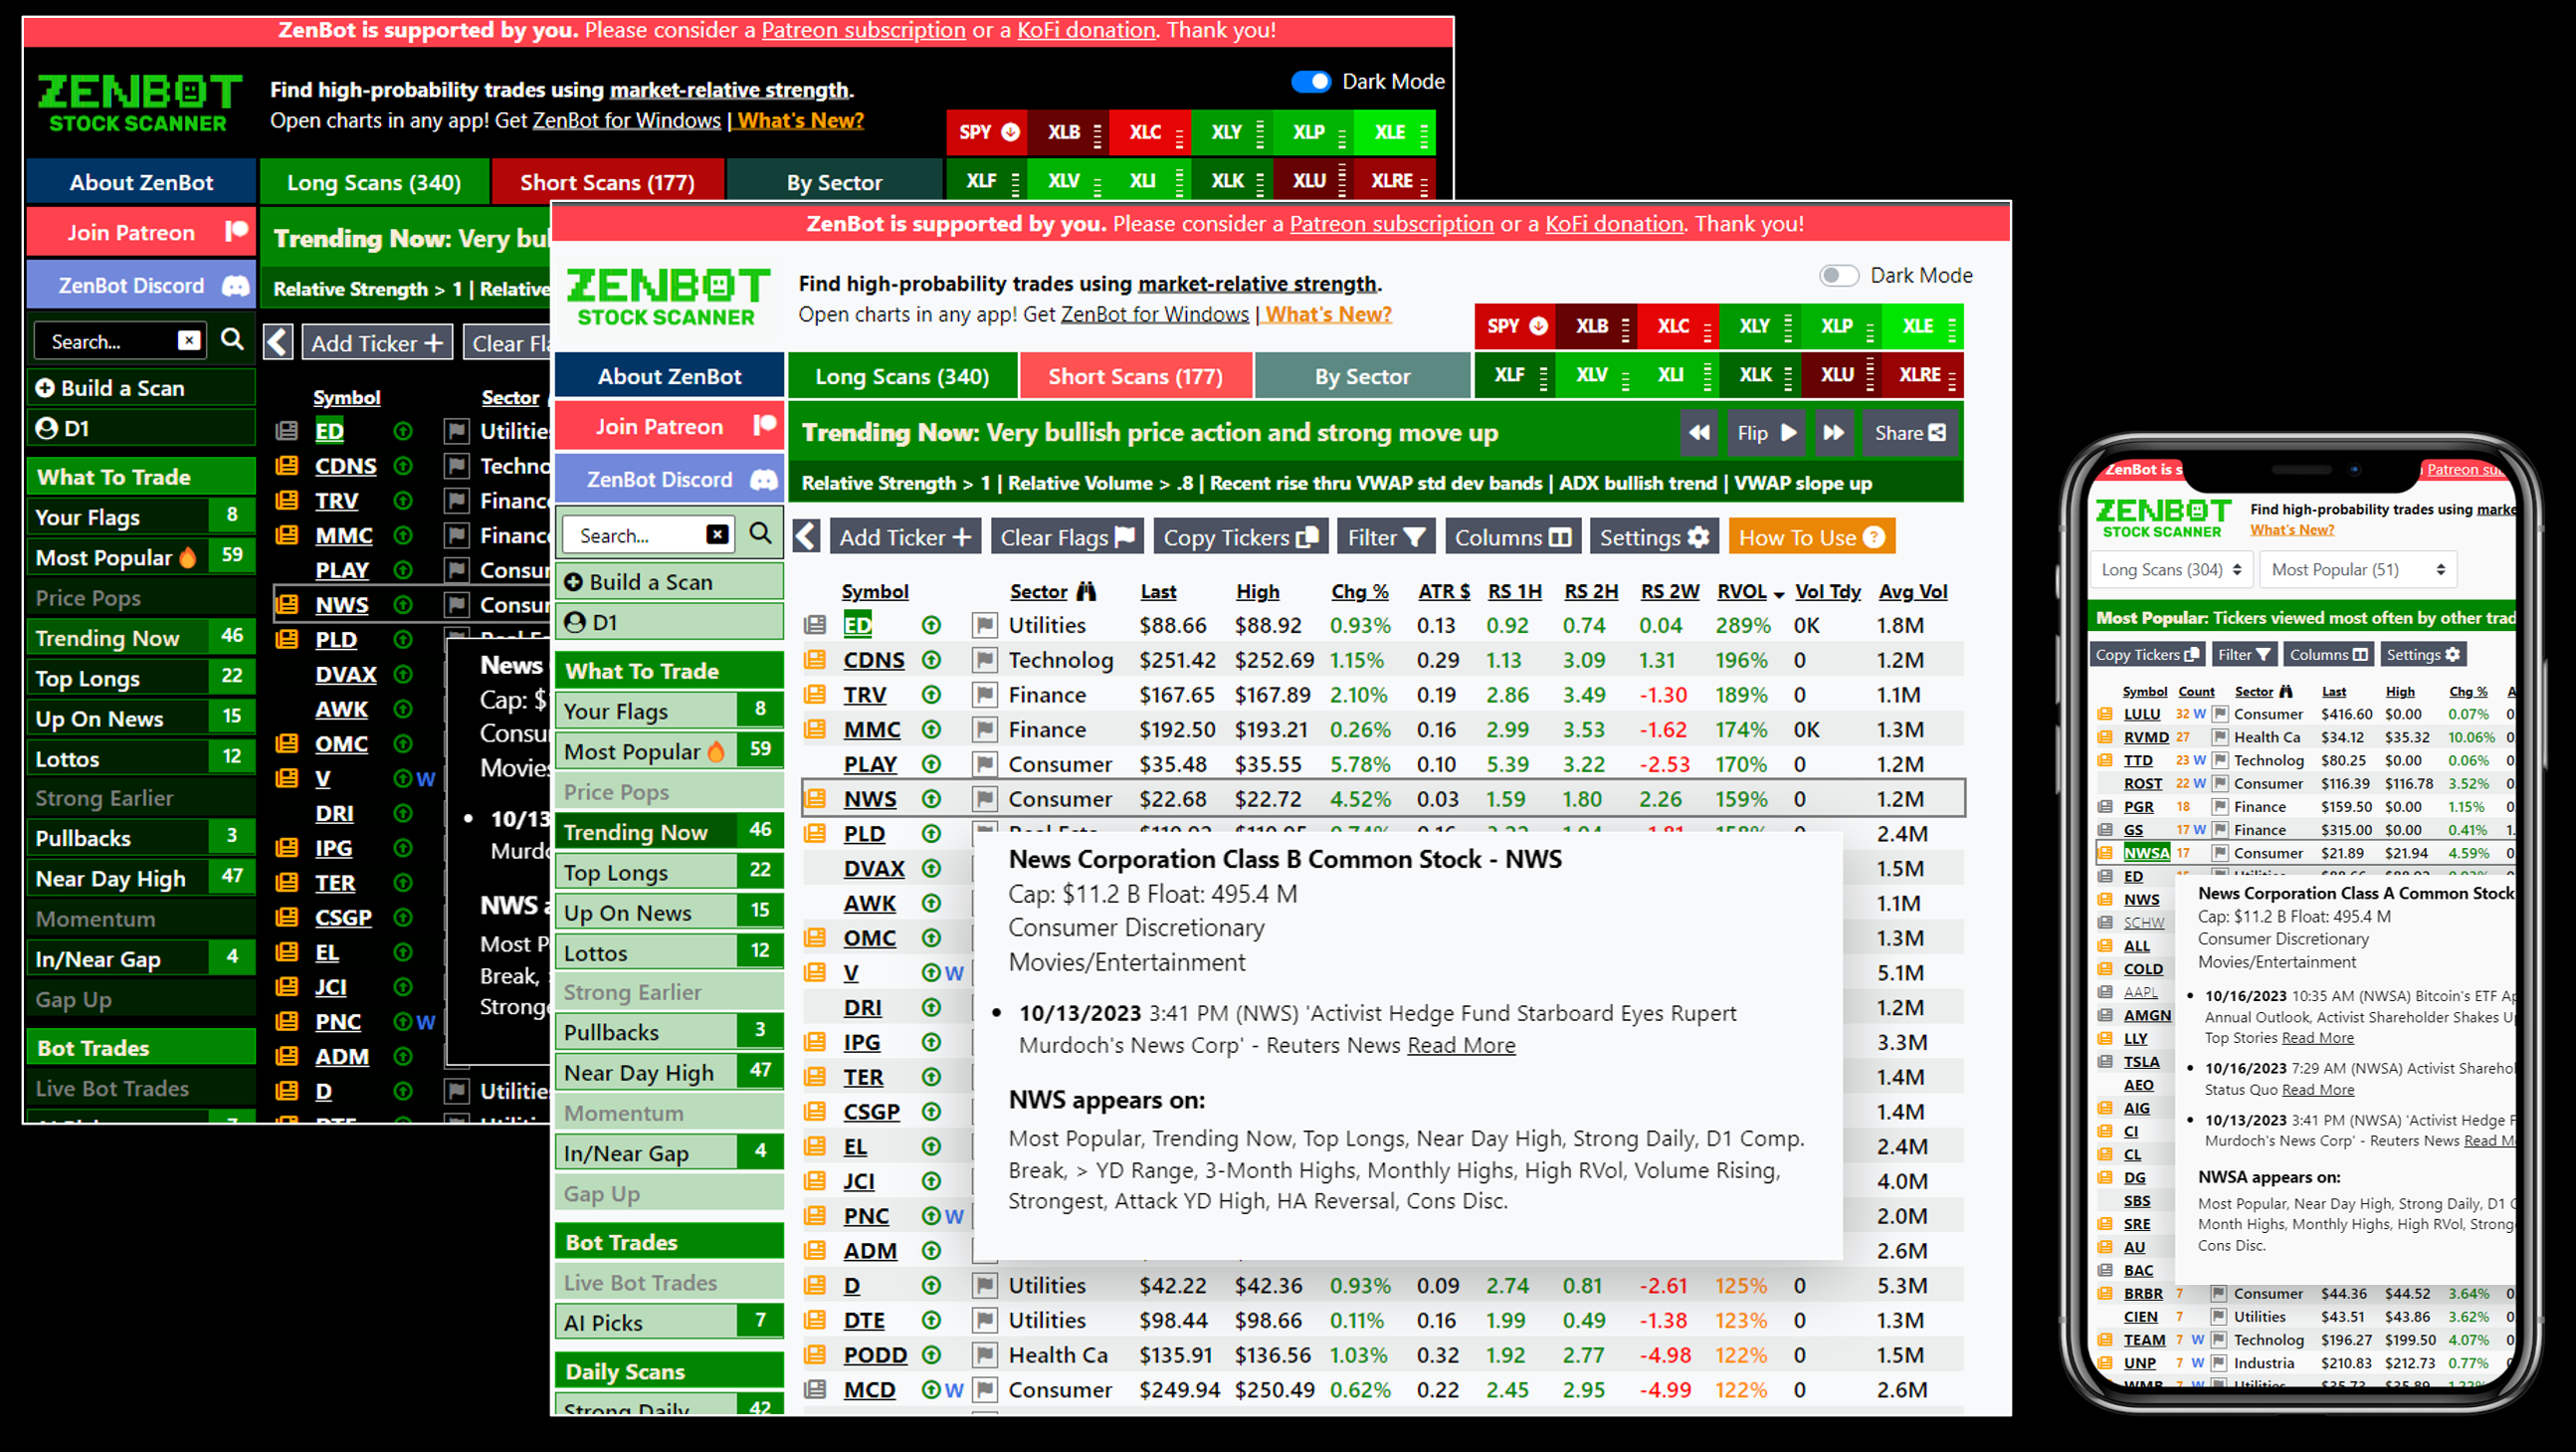
The ZenBot Stock Scanner helps you find high-probability stocks that are “in play” to trade. These stocks are stronger/weaker than the overall market and have high volume and other traits that indicate institutional interest. Learn more about the strategy.
- Fresh scans are delivered every minute, with ‘price pop’ alerts when a stock makes a big move.
- Focus on the ‘Trending Now’ and ‘Most Popular’ scans to get started. There are scans for scalpers, day traders, and short-term swing traders.
- Scan based on stock news, sectors, gaps, and other unique criteria
- Be alerted to stock ‘price pops’ and market events
- Build and share your own custom scans and filters, and customize columns to show more data.
- Download the free ZenBot for Windows app to launch tickers in your stock charting app (like TradingView, TC2000, ThinkOrSwim).
ZenBot Scanner is a one-man project supported by ZenBot Turbo subscriptions. Please consider signing up for ZenBot Turbo to help keep the bot running!
Training Videos
I’m creating a series of ZenBot Scanner intro and training videos: https://www.youtube.com/@ZenBotScanner
Note – user guide is under development; more sections will be created as more people subscribe (just kidding!)
Learn To Trade
ZenBot Scanner helps you find stocks to trade. To learn how to trade, I recommend checking out the RealDayTrading Reddit community as well as Pete Stolcers and his marvelous trading program over at OneOption. ZenBot scanner embodies these concepts (relative strength/weakness, relative volume, finding stocks that the whales are trading), and I owe much of what I have learned to Hari from RealDayTrading and Pete at OneOption.
“If I have seen further it is by standing on the shoulders of Giants” – Issac Newton
ZenBot Scanner Basics
Welcome to the ZenBot Scanner main screen. Take a few minutes to get familiar with the basic feature of the scanner. Additional guides will take you into greater detail on the various scans available, filtering results, and creating your own custom scans.
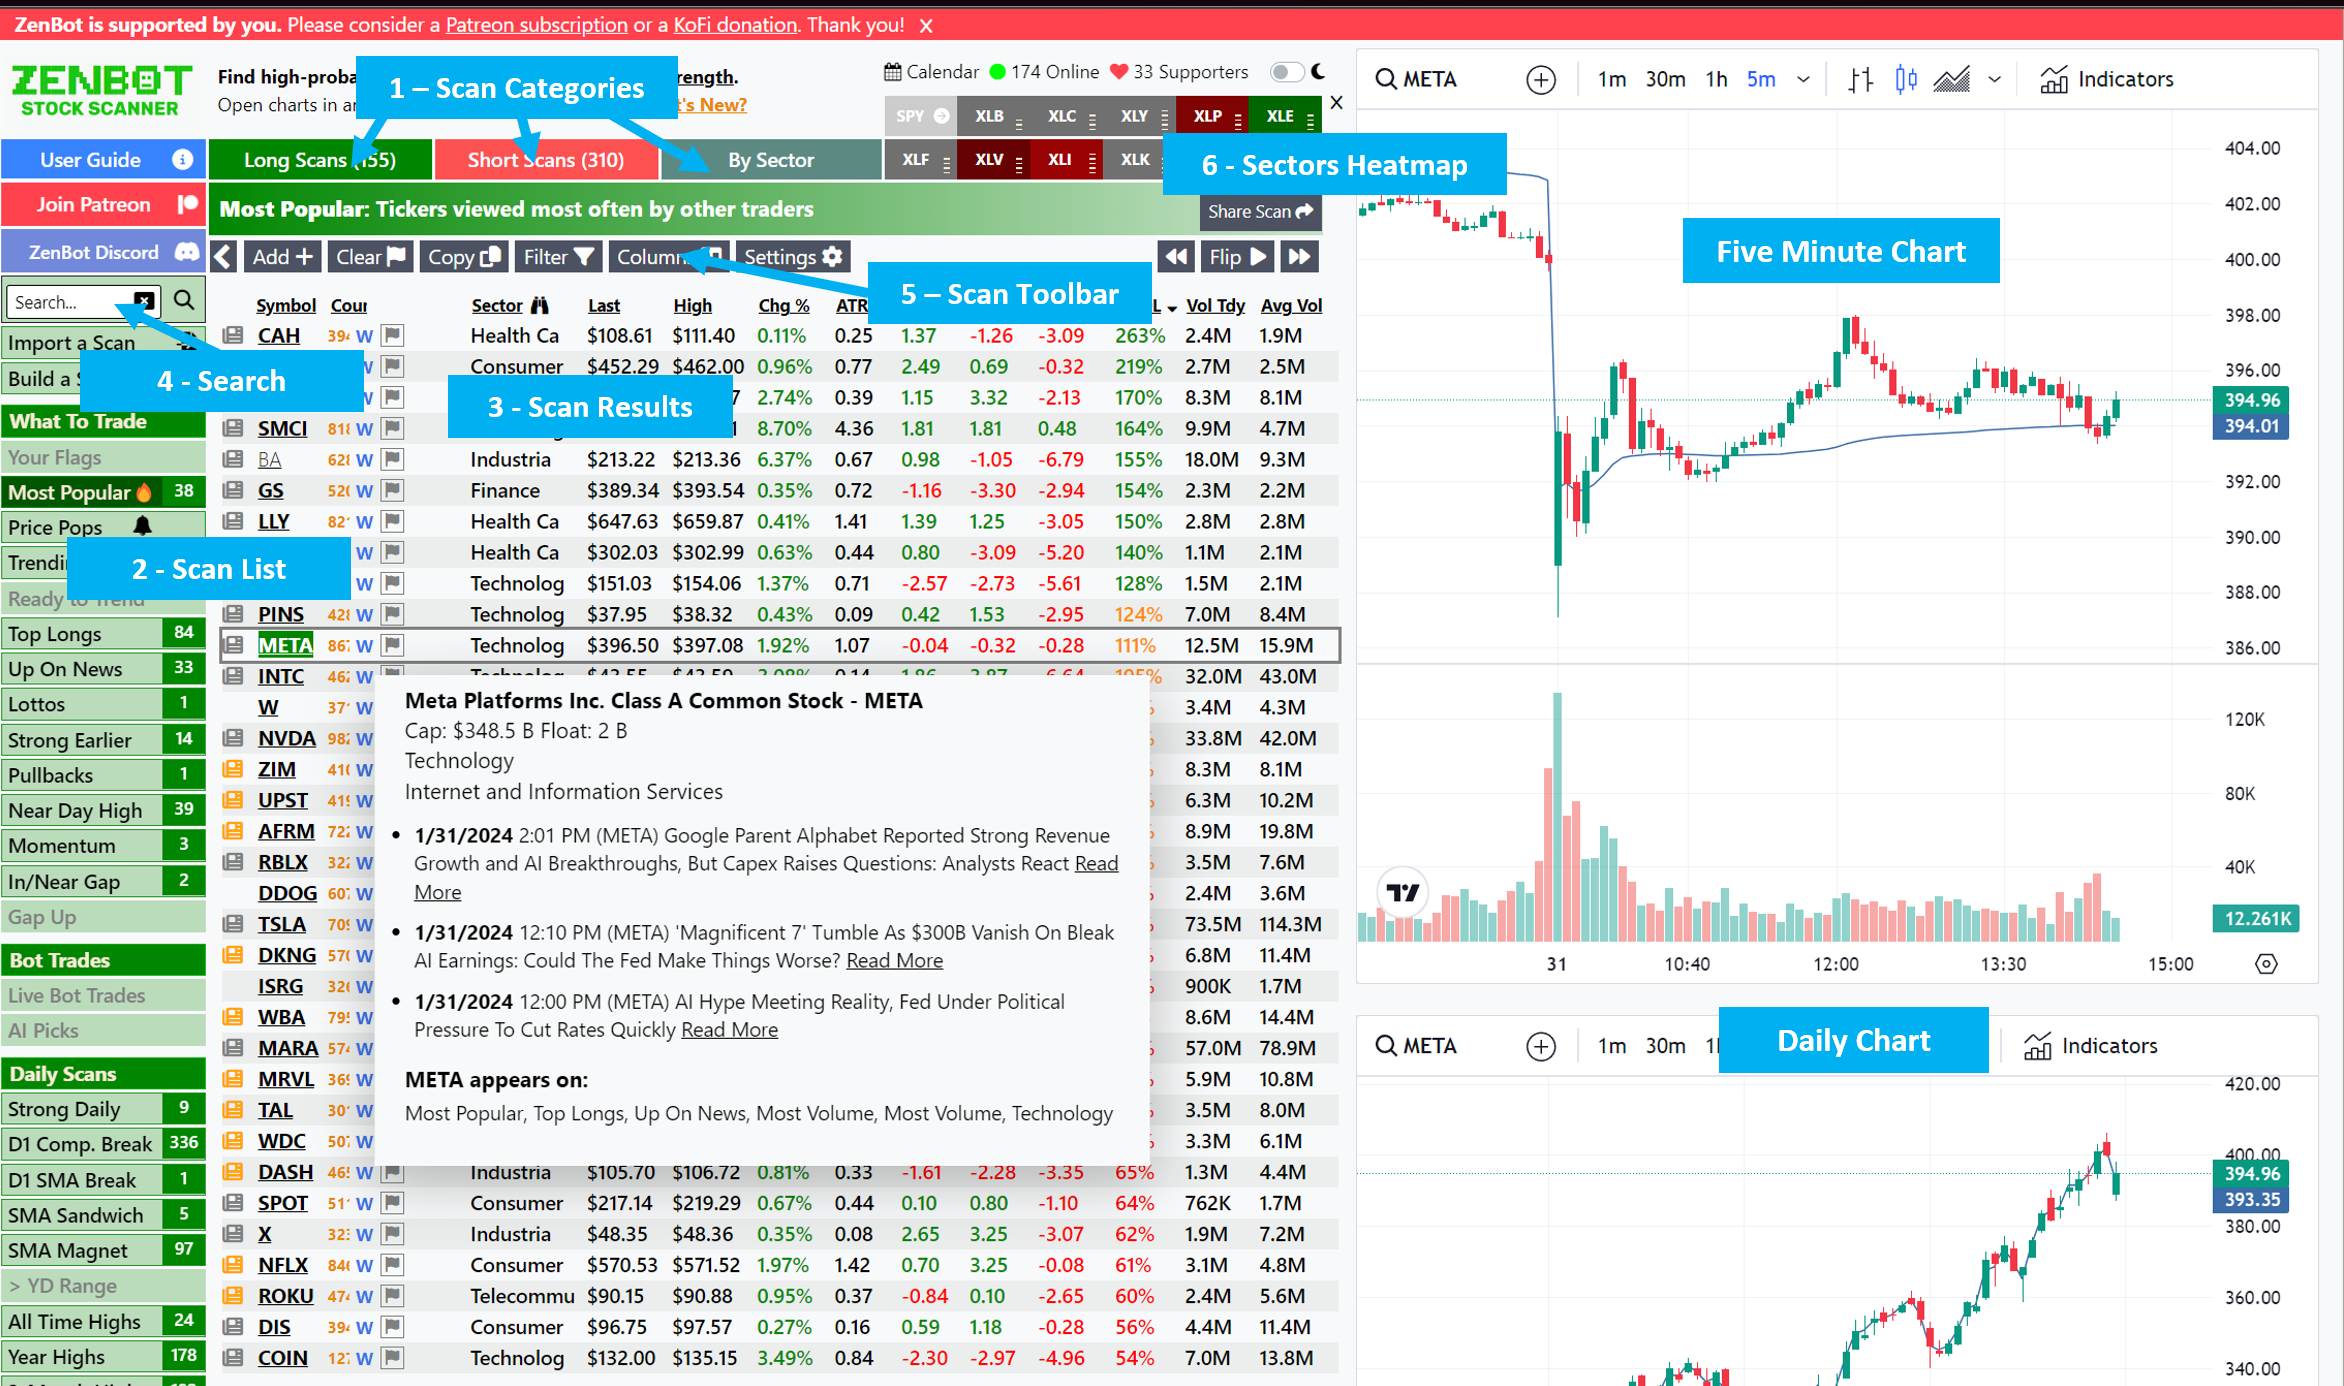
- 1 – Scan Categories (main menu)
Scans are organized into “Long” (for finding Bullish stocks), “Short” (Bearish), and “By Sector” which organizes stocks by their industry.
- 2 – Scan List
The heart of Zen are the unique stock scans which help you find stocks to trade that match your style. A great place to start is Trending Now, which shows tickers that have a strong trend and could make a good day trade. Most Popular shows you what other Zen traders are clicking on. View the scans guide for more details on what each scan is for.
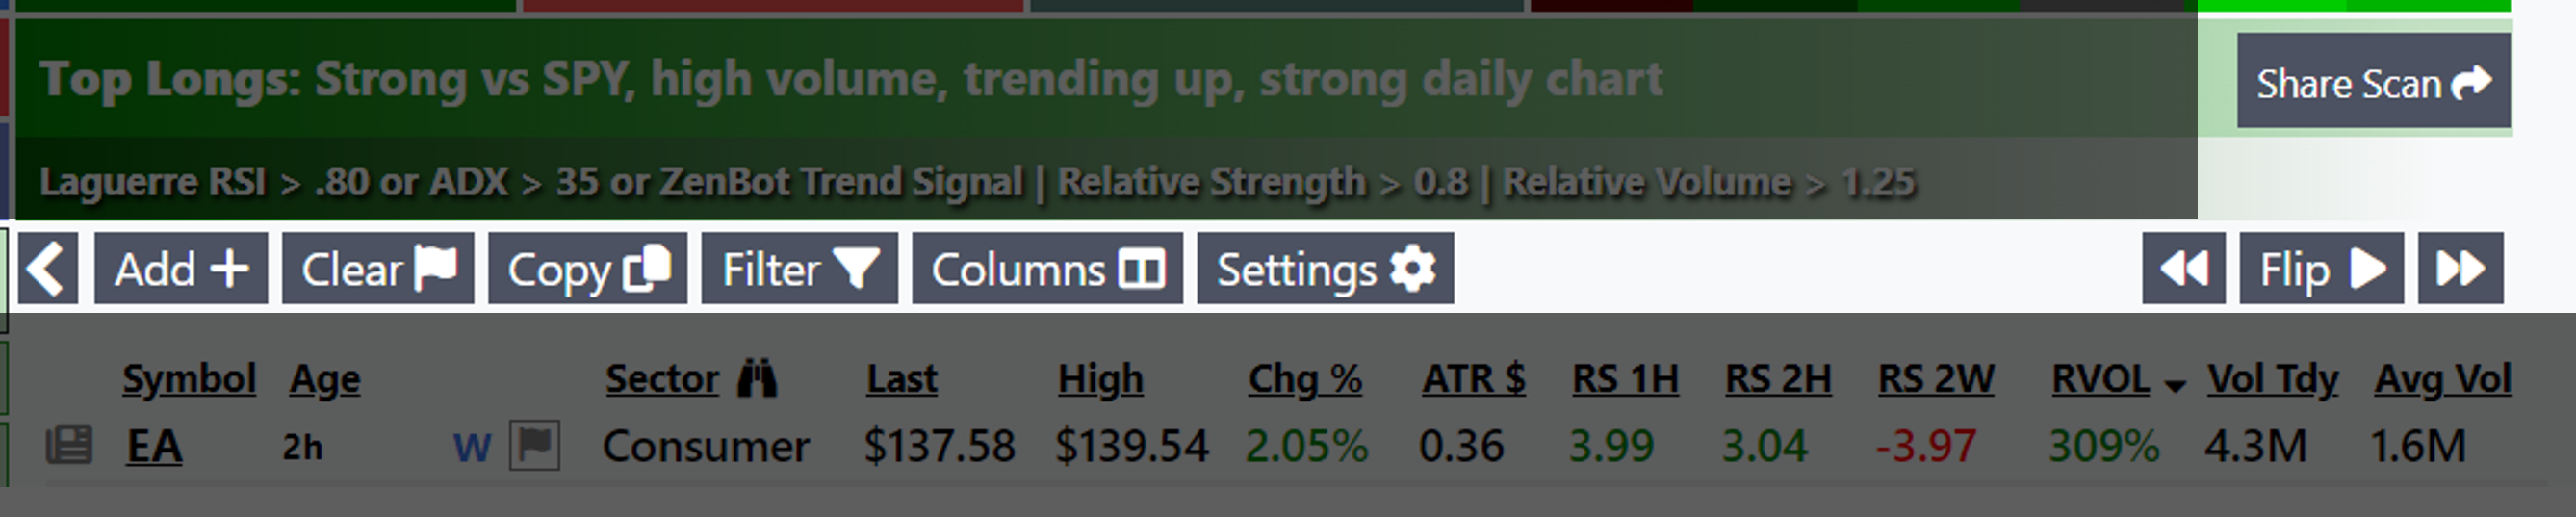
Click on a scan to view the scan results. The header will show the name of the scan and the basic criteria the scanner used to filter results.


- 3 – Scan Results
Scan results are refreshed every minute and display stocks that match the scan’s criteria on the five-minute chart.
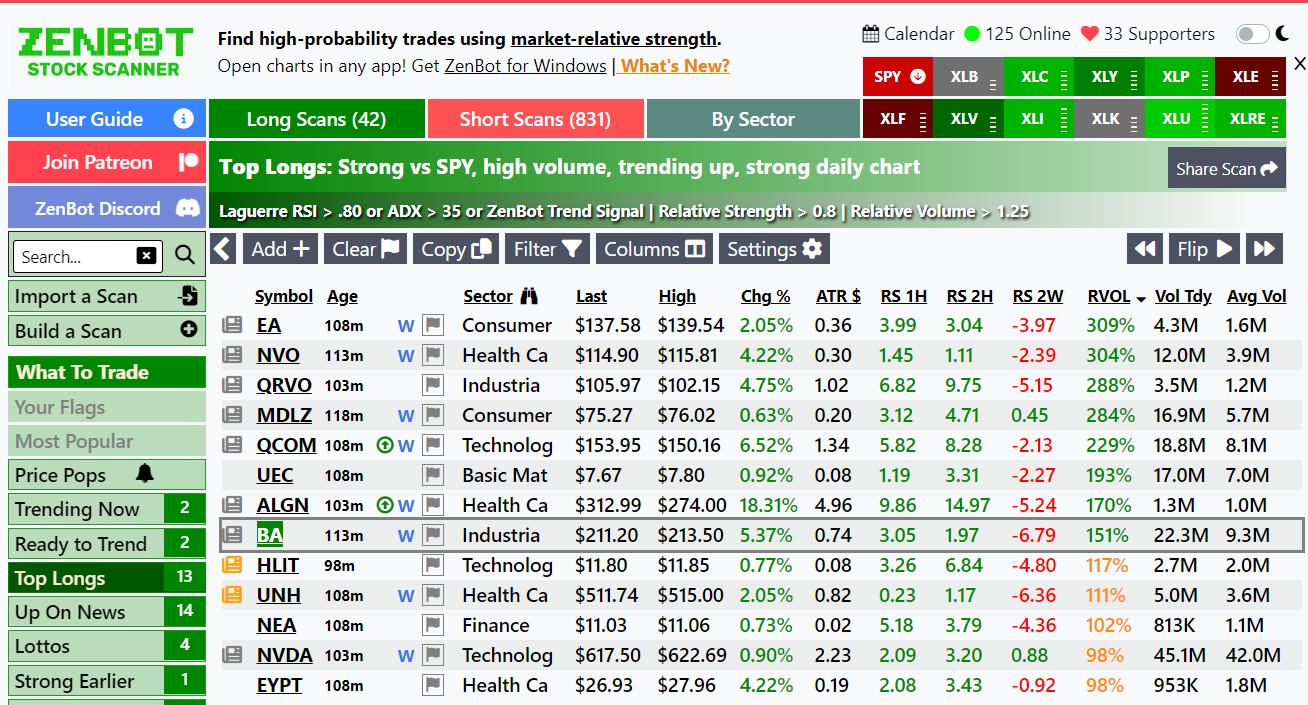
- Click on a row to view a 5-minute and daily chart for the stock.
- Click a column header to sort by that value; click it again to reverse the sort.
- Use the UP and DOWN arrow keys to move up and down the list. SPACEBAR jumps to the next ticker that hasn’t been recently viewed.
- Click the ‘flag’ icon to add the stock to your favorites list (view your favorites under the Your Flags scan). You can use the following keyboard shortcuts to quicly toggle a selected stock as a favorite: 1 – long/green, 2 – short/red, 3 – yellow, 4 – flag all non-flagged tickers as yellow.
- View more details in the Scan Results guide
- 4 – Search
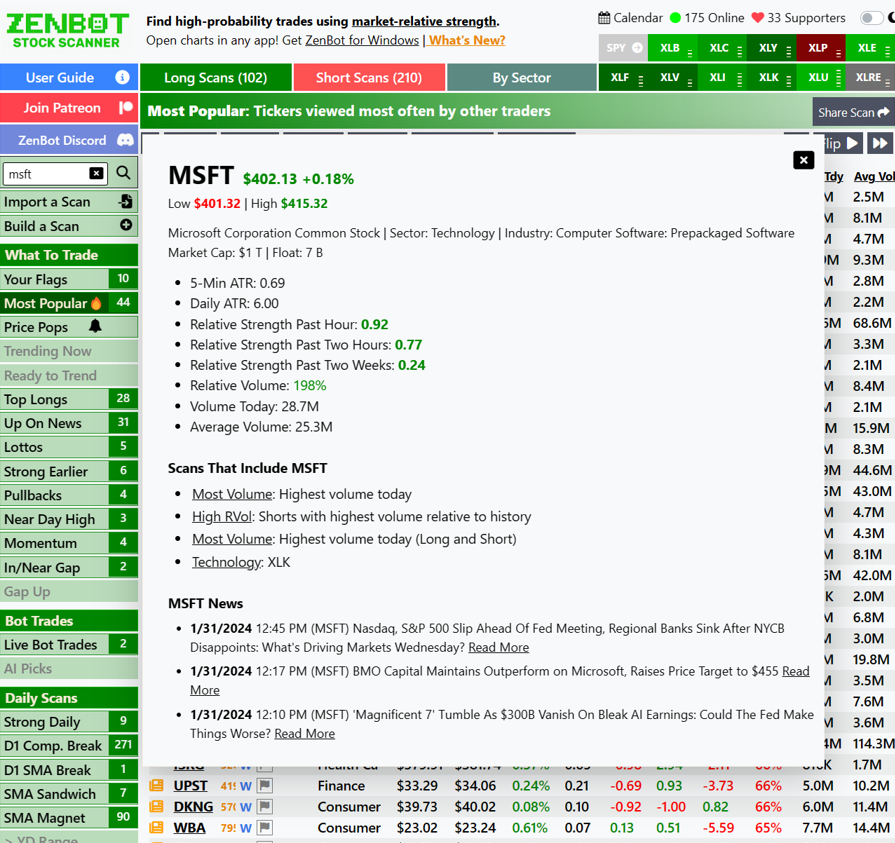
Type in a stock’s symbol to see a snapshot of the company, fundamentals, technical analysis, news, and a list of scans that contain the ticker.
- 5 – Scan Toolbar
The scan toolbar gives you the following functions:- Share Scan: get a link to the scan that can be shared
- Add: Add a ticker to your favorites list (useful if there’s a stock you want to quickly include in your favorites list)
- Clear: Clears your green/red/yellow favorites list
- Filter: Enable additional filters to narrow down scan results – such as a minimum average daily volume, or a percent change. See the filters guide for more details. Selected filters are applied to all scans within the Long, Short, and Sector sections.
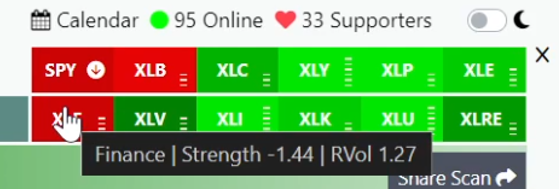
- 6 – Sector Heatmap
The sector heatmap shows you the relative strength and relative volume of each of the major industry sectors. Click a sector to jump to a list of the strongest/weakest stocks within that sector. Check out the guide on sector strength and scans to learn more.
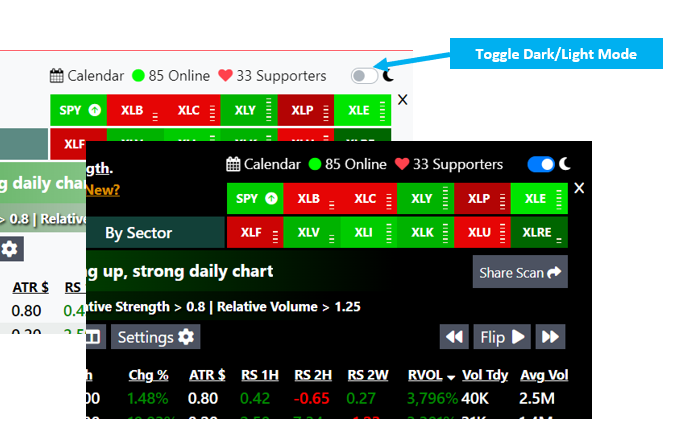
- Dark/Light Mode
Toggle between light and dark mode using the toggle icon in the upper left.
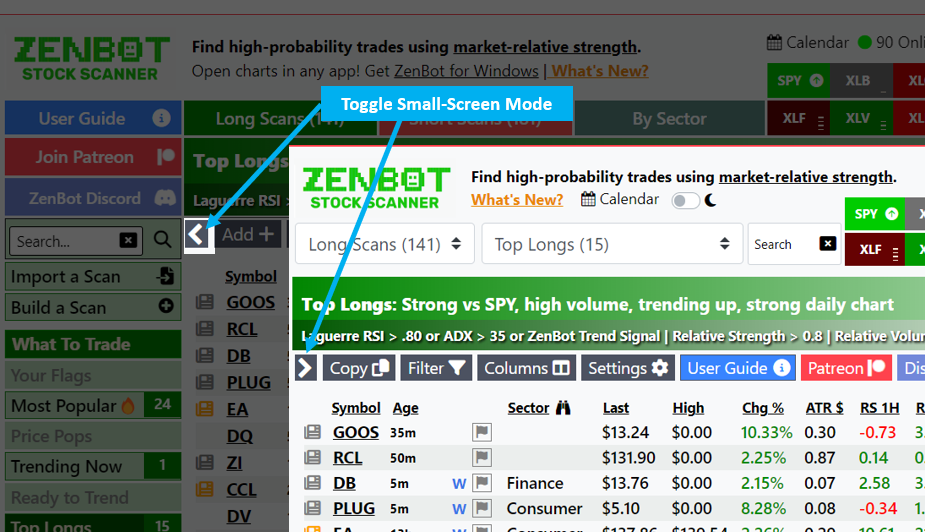
- Small Screen Mode / Expand and Collapse Menu
Click the small-screen toggle icon to expand/collapse the left menu (this is the default for small screens).
- Most Popular Stocks
Zen keeps track of the most popular stocks that other traders have recently viewed. The ‘count’ column shows the view count for the current day.
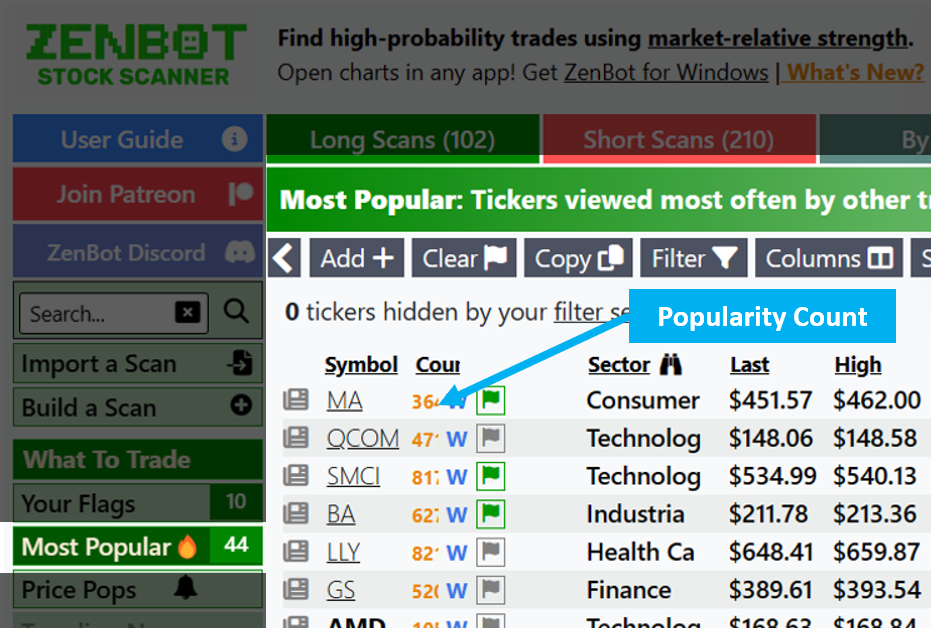
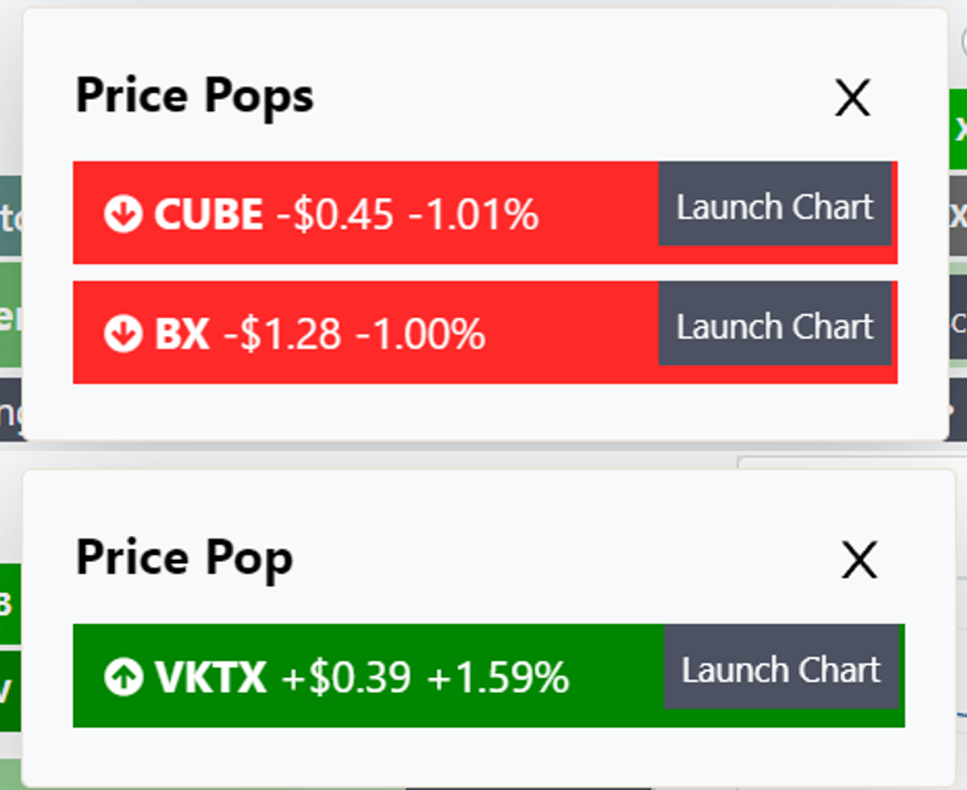
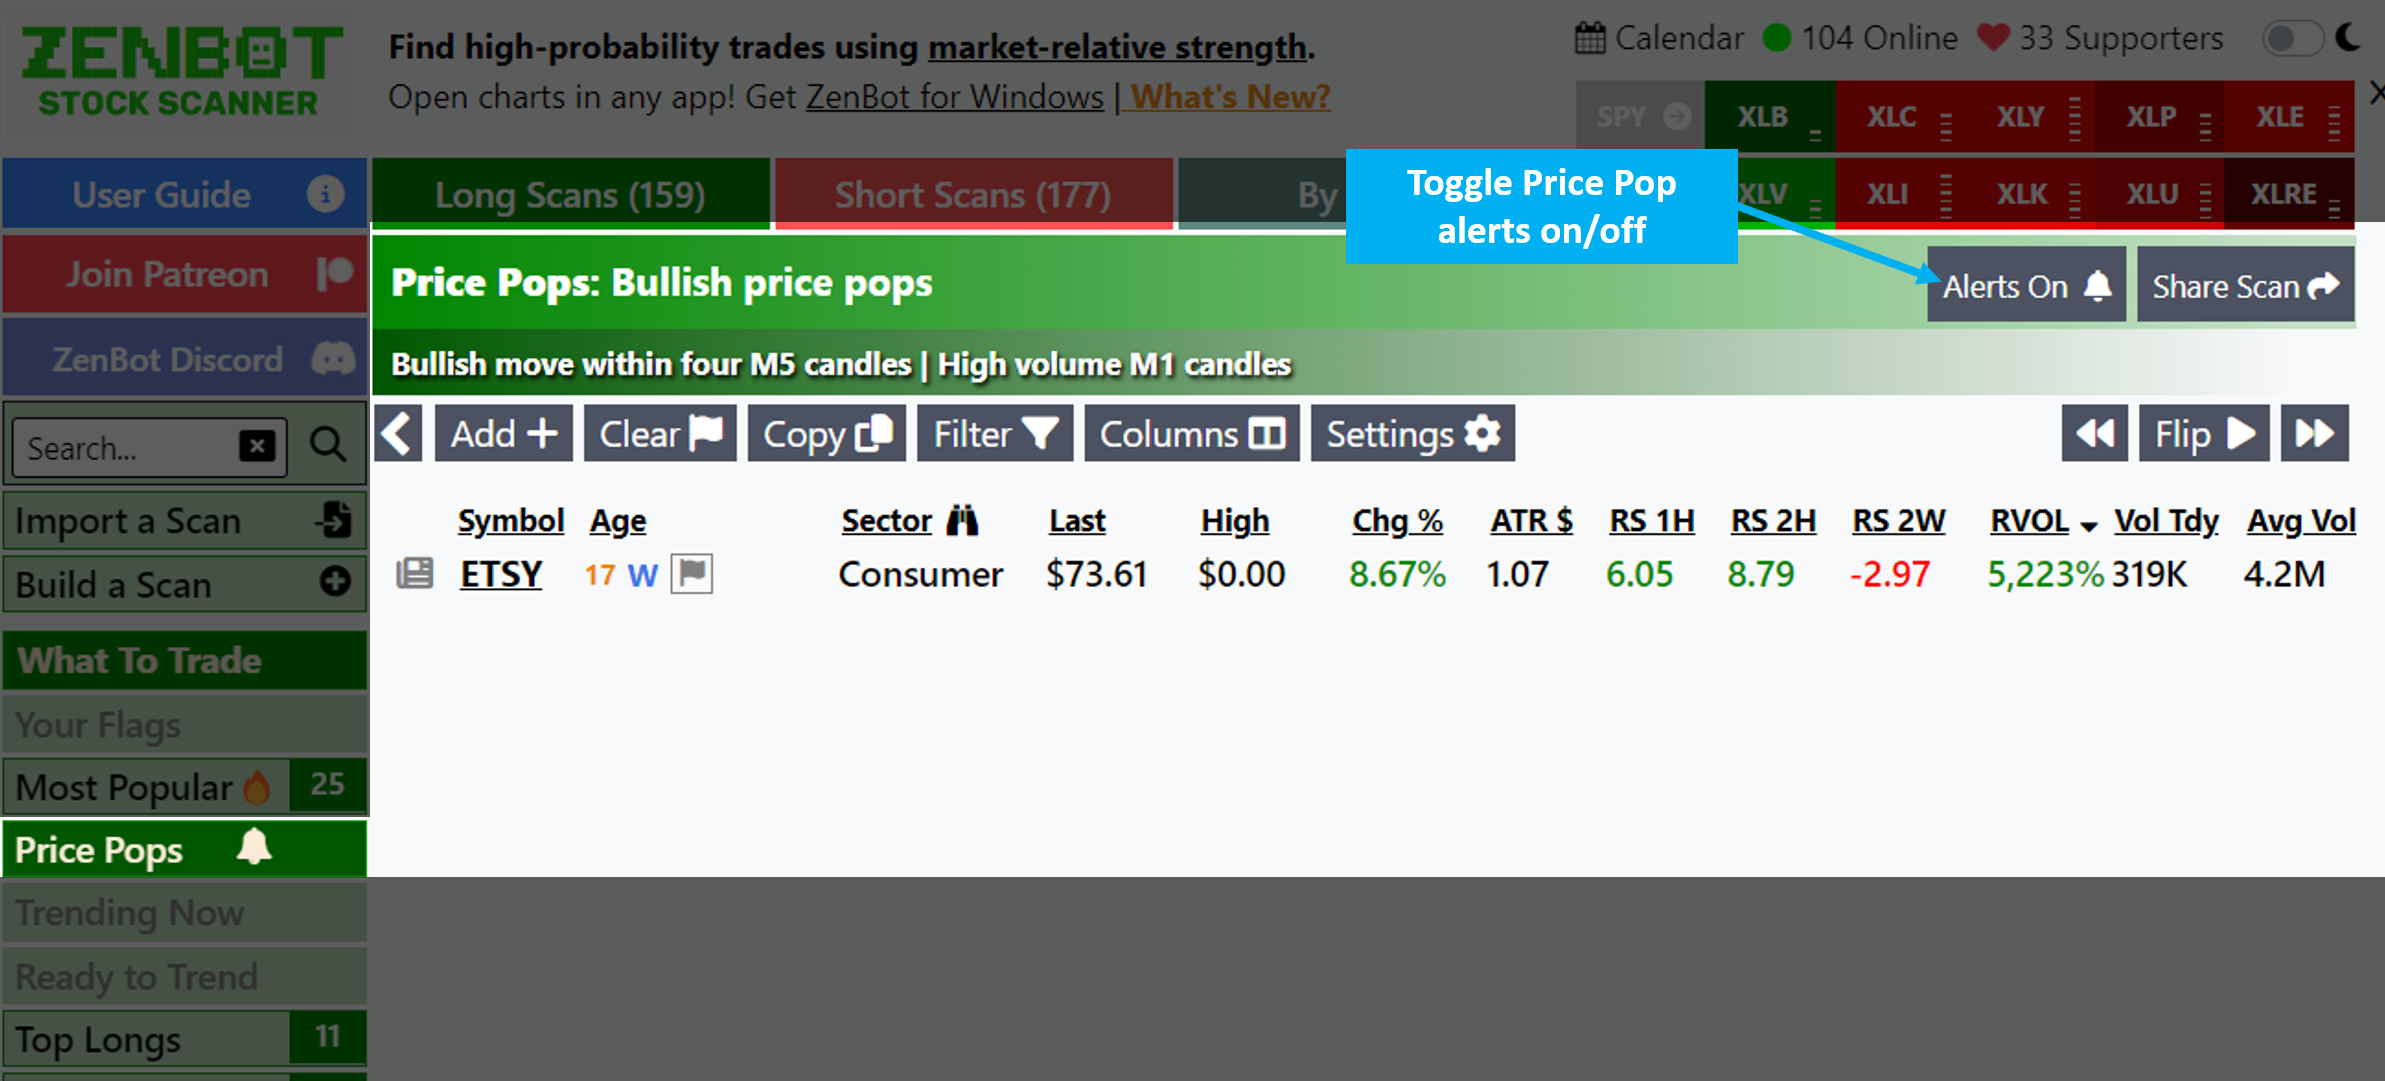
- Price Pops
Zen watches for stocks that have made a big recent move on high volume. These price pops trigger an alert. To disable the alert, click the ‘Most Popular’ scan and toggle the Alerts On/Off button.
- Favorites
- Market Calendar and Alerts
- Stock News
Stock Scans
Scan Results
Filters
At the heart of finding a good stock to trade are the many filters Zen makes available. Here are the filters and what each represent. Over time you will explore and find new combinations that work well for your style of trading.
Some filters are bullish or bearish and are available only for scans of a certain direction (long or short). Filters marked with an asterisk* are key criteria you might start with.
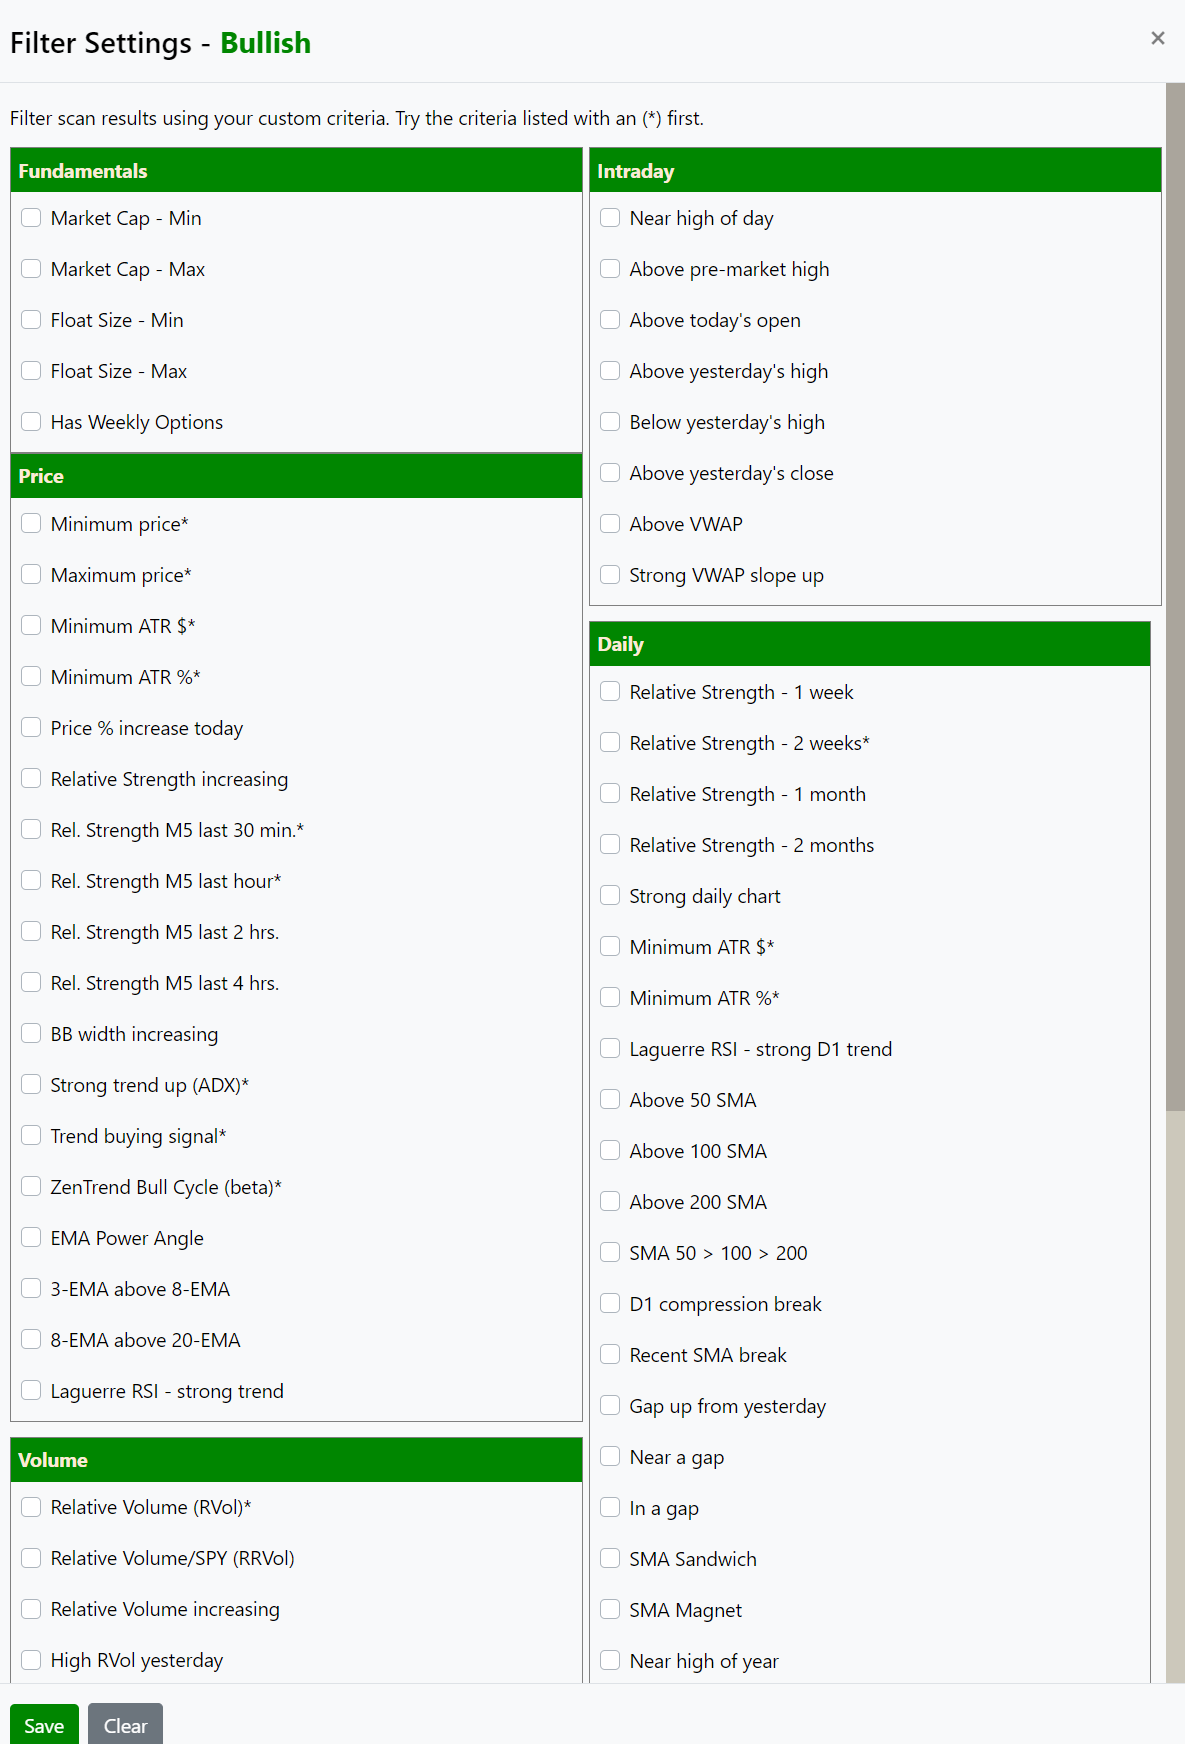
- Fundamentals – represent basics of the company itself
- Market Cap Min/Max – represents the total stock market valuation (share price x number of shares available).
- Float Size – the number of shares available for retail to trade
- Has Weekly Options – does this ticker have weekly options available?
- Price – based on the intraday 5-minute chart
- Minimum price
- Maximum price
- Minimum ATR $* – Average True Range of price over last 14-bars
- Minimum ATR %* – Average True Range of price over last 14-bars, represented as percent of the stock price
- Price % increase/decrease today – For example, stocks that moved +3.0% since yesterday’s close, or stocks that declined -3.0% today
- Relative Strength increasing/decreasing – The stock’s relative strength (percent increase compared to the overall market (SPY) over the last six bars is increasing/decreasing.
- Rel. Strength M5 last 30 min* – relative strength over the last six periods (30 minutes), compared to the overall market (SPY) as measured on the 5-minute chart
- Rel. Strength M5 last hour* – relative strength on the 5-minute chart over the past 12 periods (one hour)
- Rel. Strength M5 last 2 hrs. – relative strength over the past 24 periods
- Rel. Strength M5 last 4 hrs. – relative strength over the past 48 periods
- BB width increasing – the width between Bollinger Bands (upper and lower price range) is increasing which could imply a possible price movement.
- Strong trend up/down (ADX)* – Average Directional Index trend indicator has a strong trend (value of 35 or more)
- Trend buying/selling signal* – A ZenBot Scanner custom indicator of a very string trend. ADX is strong, VWAP slope matches the trend, the price is above VWAP if long (below if short), and price has moved thru a VWAP standard deviation band.
- ZenTrend Bull Cycle* – A ZenTrend bull/bear cycle is beginning indicating a predicted move in the desired direction. (will link to future article on the ZenTrend price cycles indicator)
- EMA Power Angle – A strong EMA 20 and EMA 8 slope in the long or short direction. EMA 20 slope > .035, EMA 8 SLOPE > .01 (reversed for short)
- 3-EMA above 8-EMA
- 8-EMA above 20-EMA
- Laguerre RSI – strong trend – LRSI > .80 for longs or < .20 for shorts.
- Volume
- Relative Volume (RVol)* – The volume in the current hour of the trading day compared to the average volume at this hour of the trading day (compared to prior 20 days). Tickers with a high relative volume (1.25x or more) indicate institutional interest or news catalyst and the potential of a strong move.
- Relative Volume/SPY (RRVol) – the relative volume (RVol) of the ticker compared to the relative volume of SPY over the same period. Tickers that have a high relative volume to SPY have their own catalyst / institutional interest beyond simply moving on a high volume market day.
- Relative Volume increasing – Relative Volume (RVol) is increasing over the past hour
- High RVol yesterday – The ticker had high relative volume yesterday (which could carry thru today)
- Minimum volume today – The filter will include tickers that have current day’s volume greater than this value
- Minimum average volume* – Limits results to tickers with the specified average daily volume (calculated using the last 20 days)
- Volume fill* – Limits results to ticker that have attaned at least this percent of their average daily volume. For example, a value of 85% will return a ticker with an average daily volume of 1,000,000 that has achieved 850,000 volume for the current day.
- Price Patterns
- Consolidating – Price is consolidating on the 5-minute chart according to the Bollinger Band indicator
- Making new highs/lows – Three candles in a row making new highs/lows
- VWAP hard rejection – Price has retraced to VWAP and then bounced in a bullish way (longs), or was rejected in a bearish way (shorts)
- Above/Below yesterday’s range – Price is one standard deviation above/below the five-day range on the D1 chart
- HA Compression Break – A Heiken Ashi reversal candle (small body, long upper and lower wick) after a period of compression (using Bollinger Bands)
- Heiken Ashi Reversal – A recent Heiken Ashi reversal candle
- Heiken Ashi Continuation – Multiple Heiken Ashi continuation candles in a row (flat bottom is bullish, flat top is bearish) on heavy volume
- Bull/Bear Flag – Earlier strong trend that has pulled back
- Recent 3/8 EMA cross – EMA 3 has recently crossed EMA 8 (in a bullish or bearish way)
- Recent 8/20 EMA cross – EMA 8 has recently crossed EMA 20 (in a bullish or bearish way)
- Intraday
- Near high/low of day
- Above/below pre-market high
- Above/below today’s open
- Above/below yesterday’s high
- Above/below yesterday’s high
- Above/below yesterday’s close
- Above VWAP
- Strong VWAP slope up/down
- Daily
- Relative Strength – 1 week – Stock’s relative strength to the market/SPY on the daily chart for the past week
- Relative Strength – 2 weeks* – relative strength on the daily chart for the past two weeks
- Relative Strength – 1 month
- Relative Strength – 2 months
- Strong/Weak daily chart – Three green days in a row, Daily EMA 3 > EMA 8, and last D1 close > EMA 8 (reverse for weak/shorts)
- Minimum ATR $* – Average True Range of price over last 14 days
- Minimum ATR %* – Average True Range of price over last 14-bars, represented as percent of the stock price
- Laguerre RSI trend – strong D1 LRSI > .80 for longs or < .20 for shorts.
- Above 50 SMA – Above 50 simple moving average (SMA) on the daily chart
- Above 100 SMA
- Above 200 SMA
- SMA 50 > 100 > 200
- D1 compression break – Price is one standard deviation above/below the five-day range on the daily chart
- Recent SMA break – Recent move thru a major daily moving average (50, 100, 200)
- Gap up/down from yesterday – Price is opening 1.5% higher or lower than yesterday’s close
- Near a gap – Price is near a significant gap between bars on the daily chart. Price tends to fill gaps, so these are good potential trades.
- In a gap – Price is within a gap on the daily chart
- SMA Sandwich – Price is between two major simple moving averages on the daily chart (50, 100, 200). These can be interesting trades since the price often has support from one moving average and a “magnet” attraction to the next.
- SMA Magnet – Price near a major moving average on the daily chart. SMAs often act as a magnet pulling the price toward it.
- Near high of year
- Near three-month high
- Near monthly high
- New highs within 10 days – Price has made new highs within the past 10 days
- New highs within 20 days
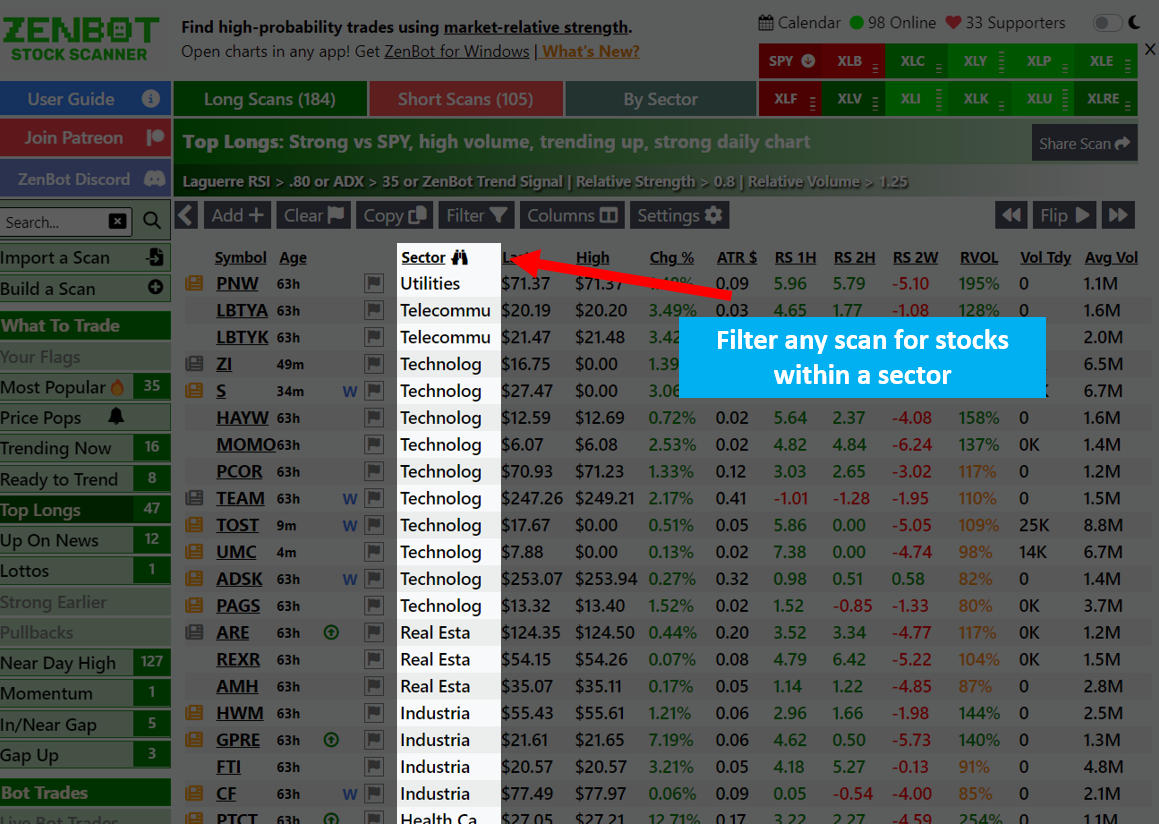
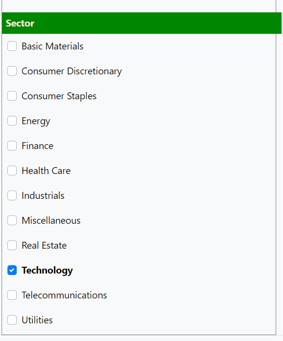
- Sector
- Filter stocks within a certain industry/sector
Custom Scans
Sector Strength and Scans
Zen can help you find a sector that is stronger (weaker) than the market, as well as the strongest (weakest) stock within that sector.
When selecting a stock to trade, it’s important to find one that is moving stronger than the overall market. This gives you an edge – if the market starts to pull back, you will have an “early warning” to take profits. If the market makes a big move, your stock will likely make a BIGGER move. Zen helps you find stocks with ‘relative strength or weakness’ to the overall market, to SPY. However, there is another layer to the edge – selecting a stock within a strong (weak) sector/industry. This provides a “double edge”.
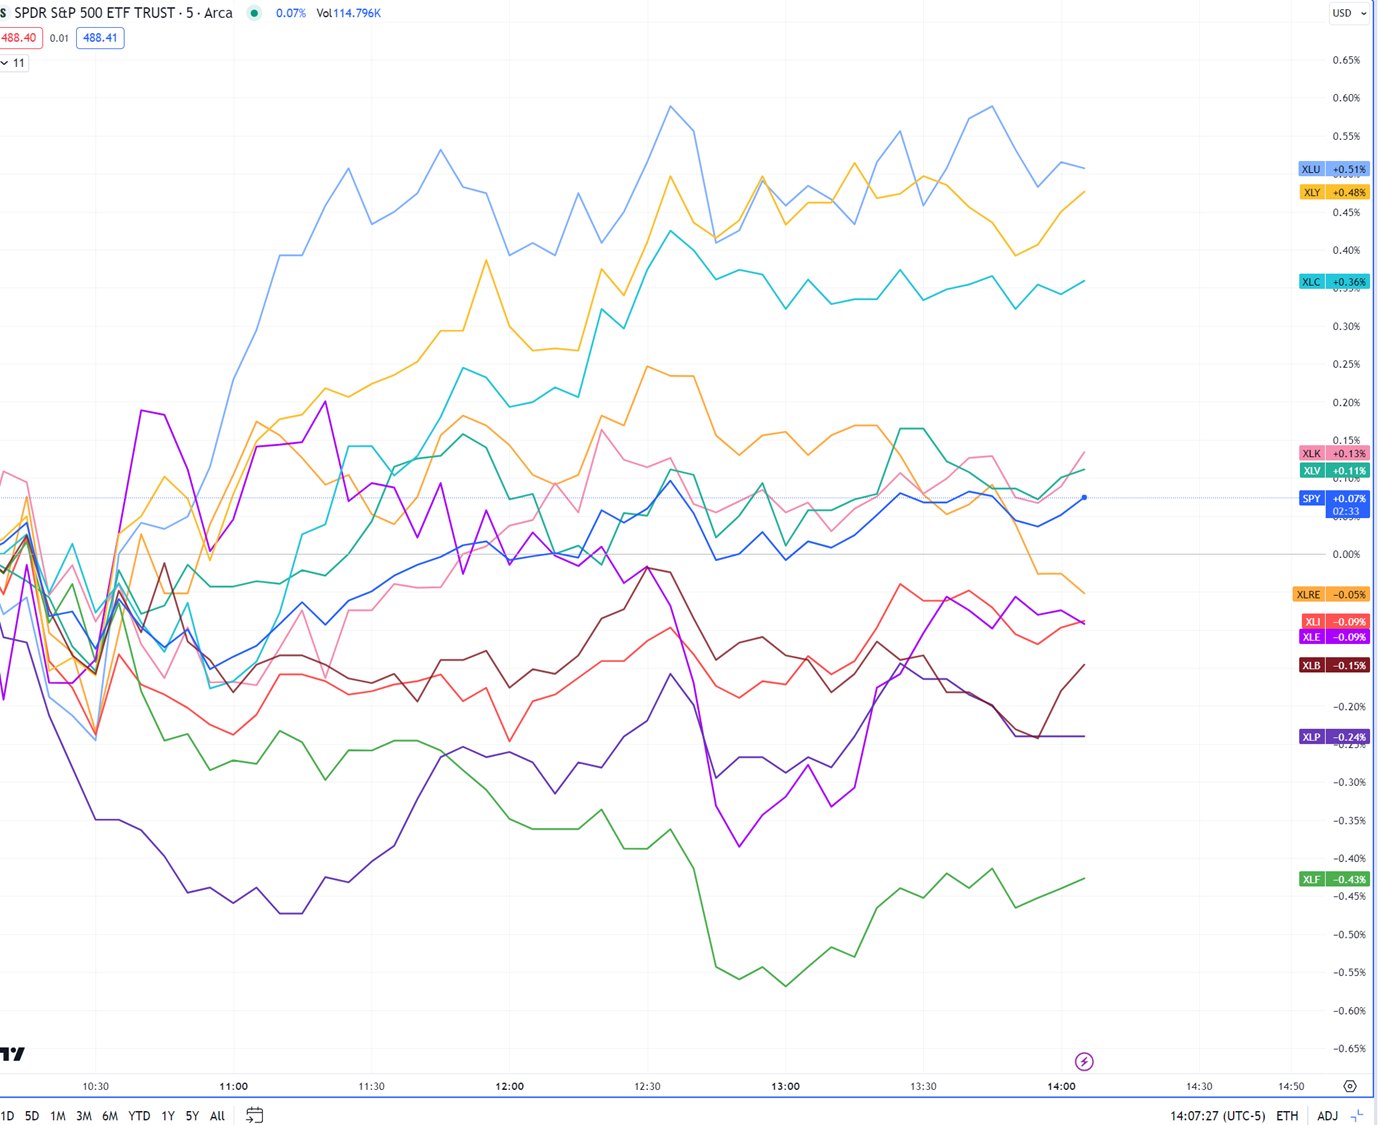
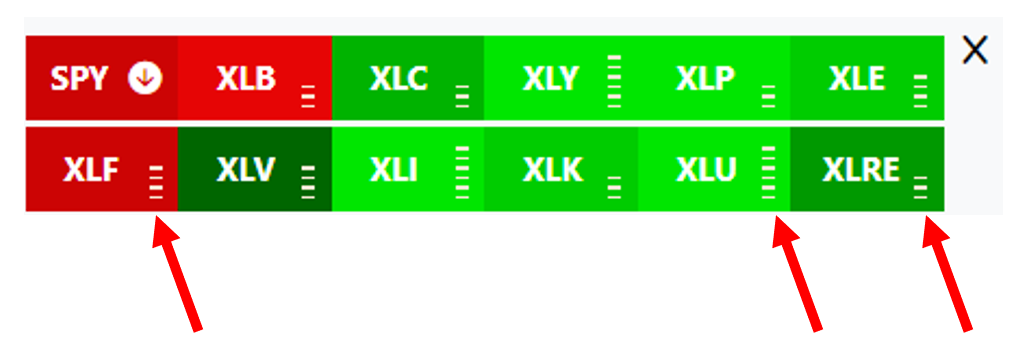
Zen provides a sector heatmap that shows you the real-time strength, weakness, and relative volume of each of the major sector ETFs.
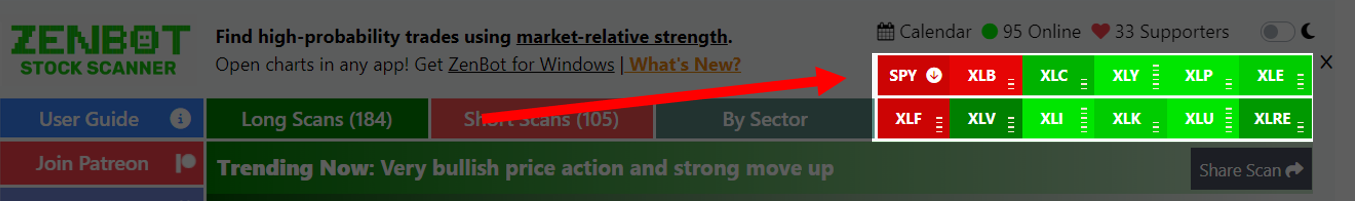
- SPY: S&P 500 Index
- XLC: Communication Services
- XLP: Consumer Staples
- XLE: Energy
- XLF: Financials
- XLV: Health Care
- XLI: Industrials
- XLB: Materials
- XLRE: Real Estate
- XLK: Technology
- XLU: Utilities
Zen calculates each sector’s relative strength/weakness to the overall market (SPY). The shade of red/green indicates relative strength. Hover your mouse over the sector to see each sector’s relative strength.
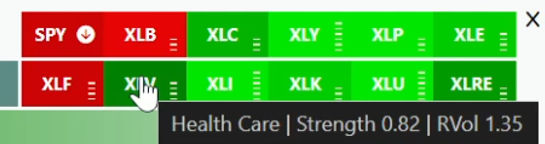
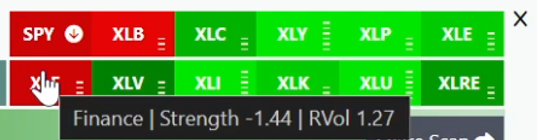
Each sector icon has a “relative volume” strength indicator. The more bars, the more relative volume (volume compared to average volume during this hour over the previous twenty trading days). The SPY icon shows you the current trend (up, down, flat) for the overall market.
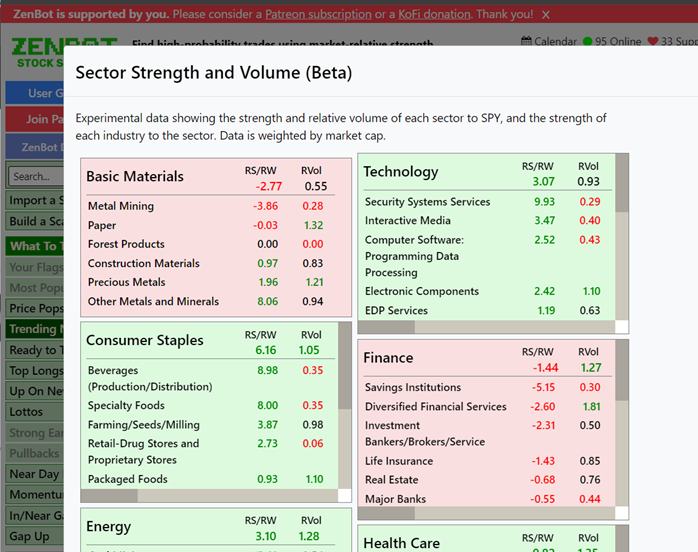
Click on the SPY icon to bring up a detailed view of each sector’s relative strength/weakness and each industry within that sector.
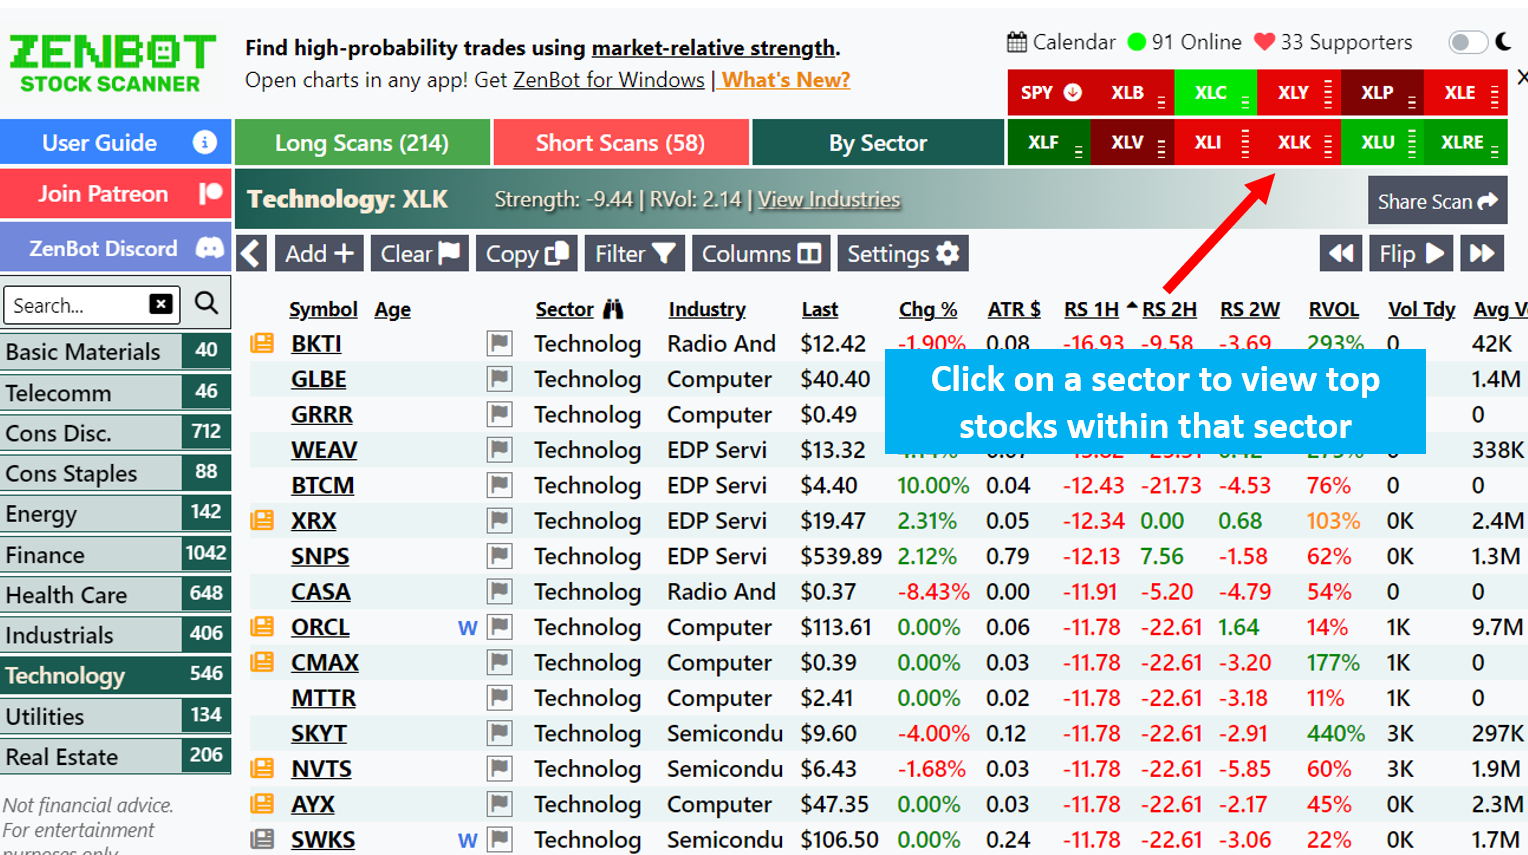
Click on a sector icon to jump to Zen’s scan for that sector. This helps you quickly identify the strongest and weakest stocks within that sector.
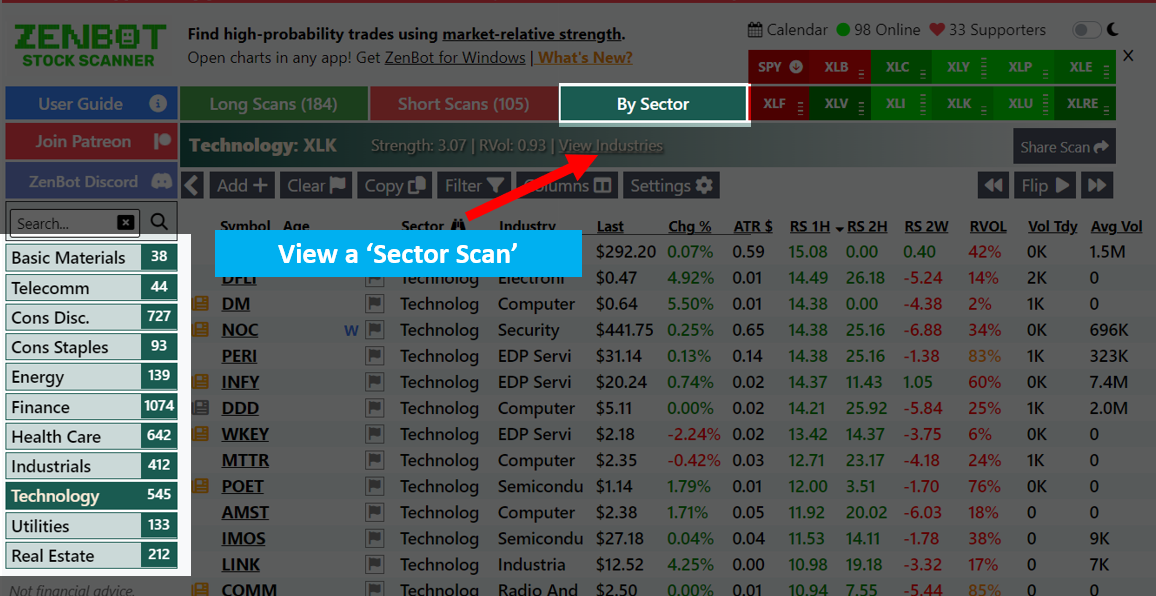
ZenBot Scanner includes sector-specific scans as well as the ability to sort and filter by sector in any scan.
Market News Calendar
Price Pops
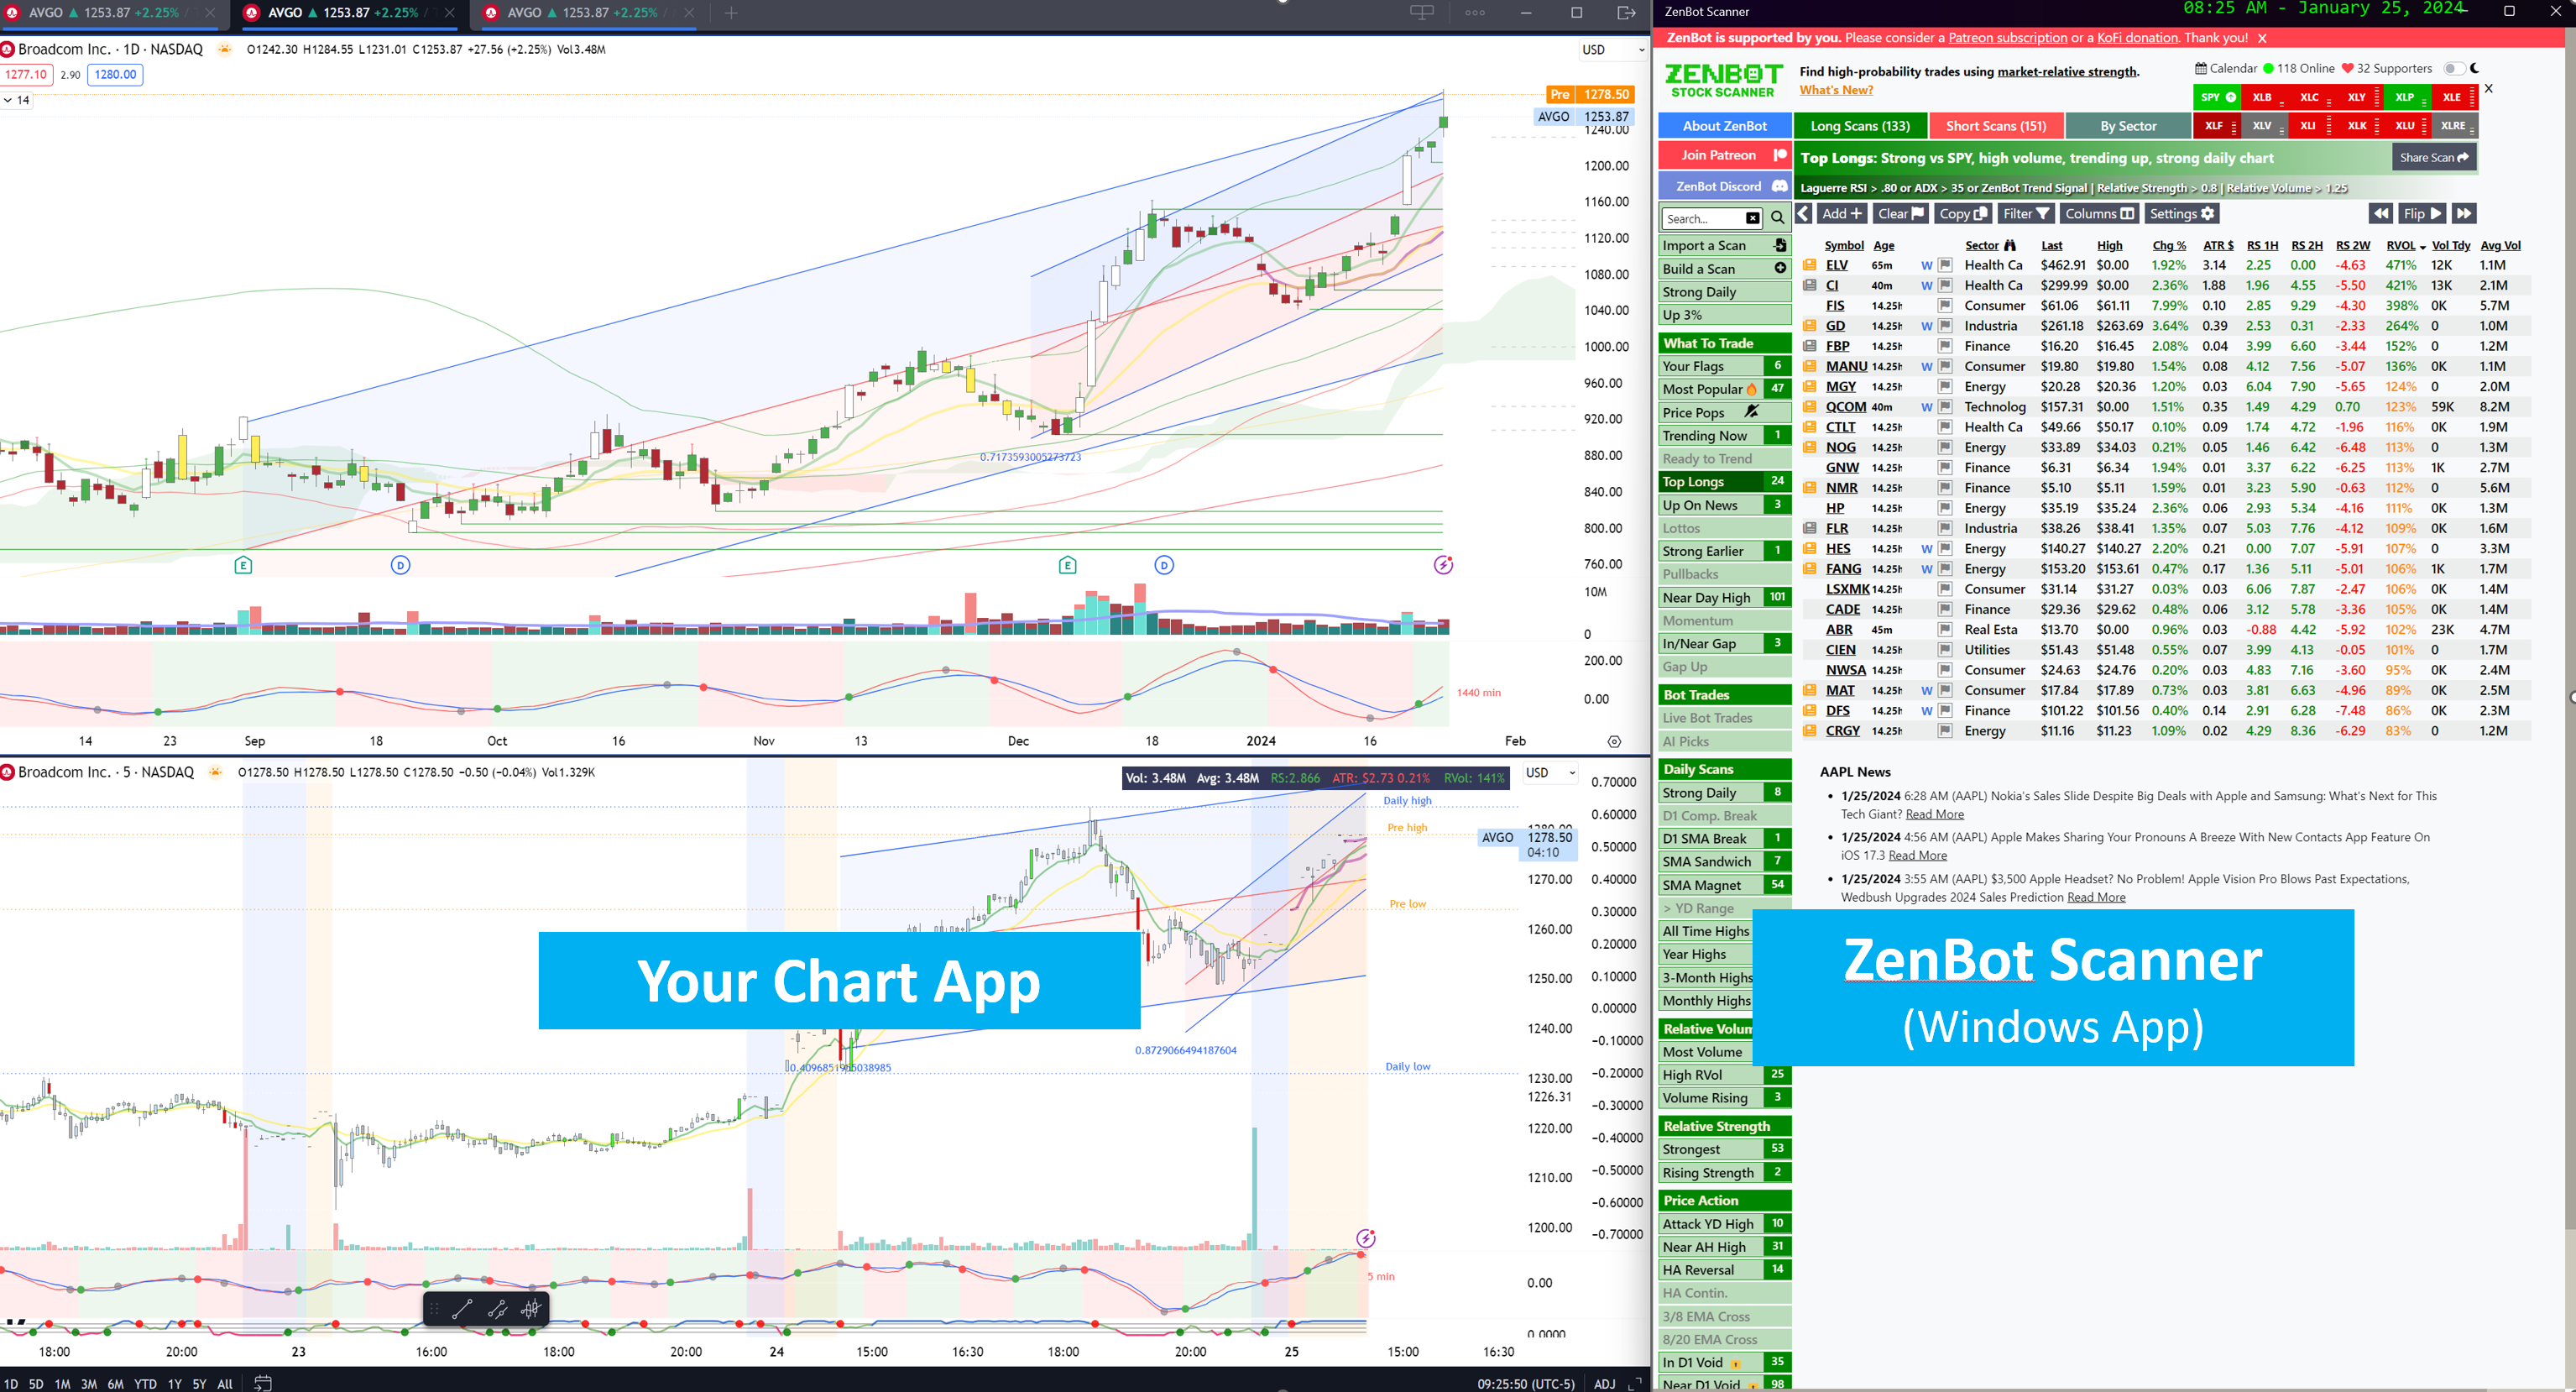
Launch Charts in Your Charting App (ZenBot Scanner Windows App Only)
The ZenBot Scanner Windows app can launch tickers in your favorite stock charting app (like TradingView, ThinkOrSwim, TC2000, IBKR, and lots more) by automatically moving the mouse to the charting app’s window, clicking, entering the keystrokes for the selected ticker, and pressing the ENTER key. It happens so fast it feels like magic.
1. Position the ZenBot Scanner Windows app next to your charting app
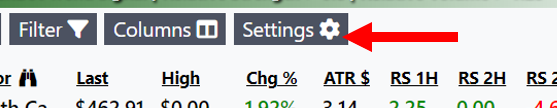
2. Click “Settings”
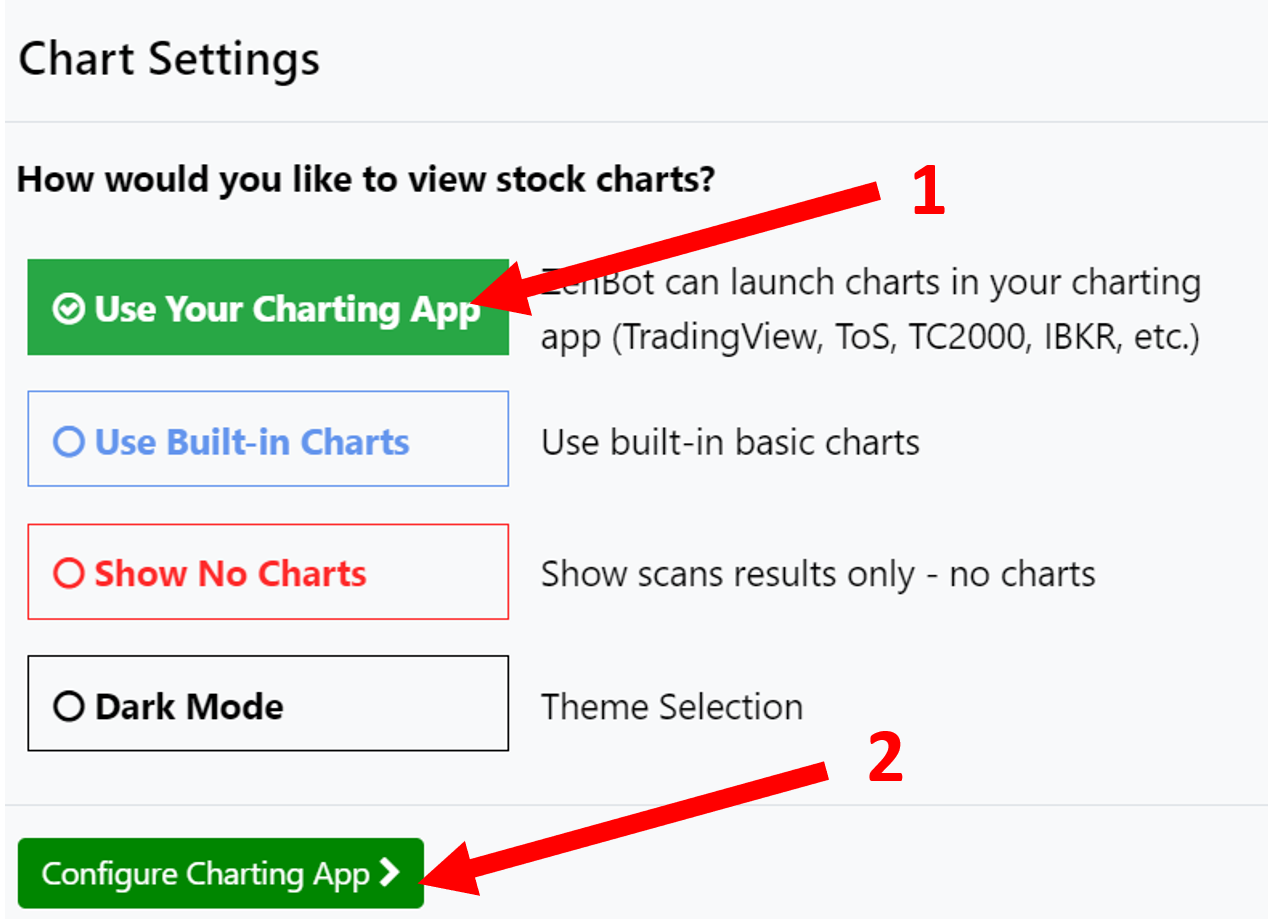
3. Click “Use Your Charting App” and then “Configure Charting App”
4. Next, show Zen where you want it to type the keystrokes when a symbol is launched. For TradingView, typing anywhere on a chart will bring up the stock selection window – so Zen can simply click the mouse in the window and start typing. For other apps like ThinkOrSwim, a specific symbol-entry box must be clicked on.
Once you decide where Zen should click and type the symbols, click “Set Auto-Click Location” to put Zen into training mode.
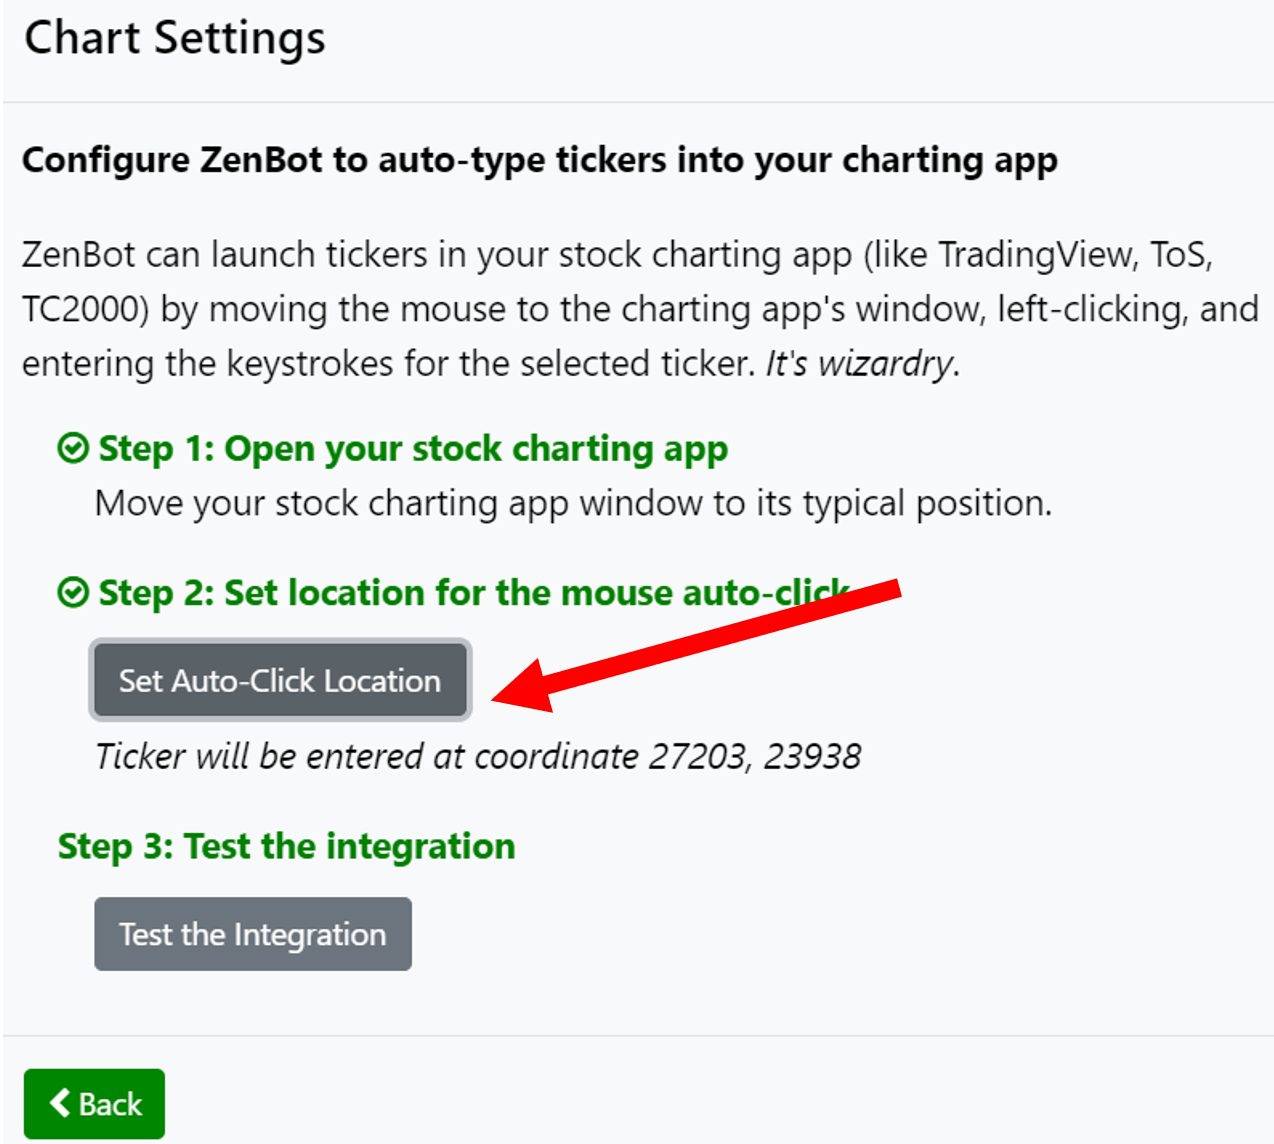
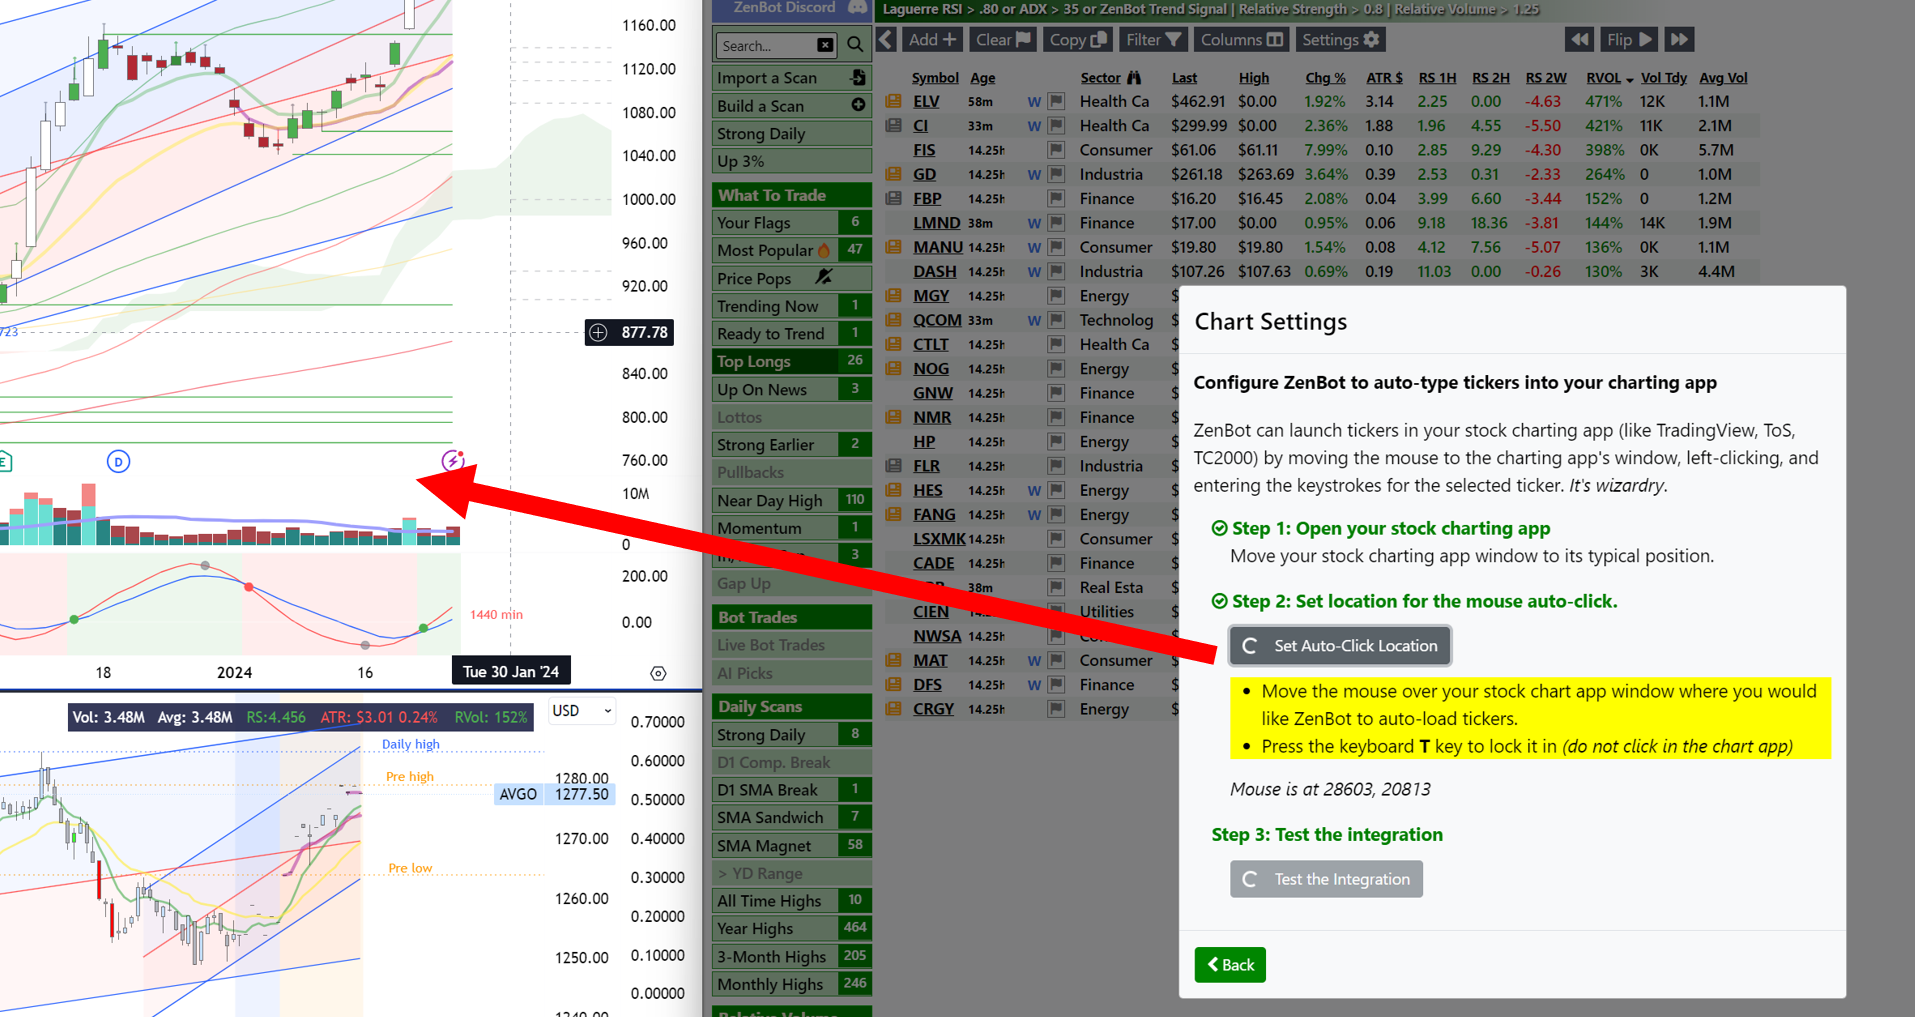
5. Follow the instructions to move your mouse to the location where Zen will type the symbol when launching charts. Move your mouse to the desired location within your charting app. When you are ready, press the ‘T’ key on your keyboard to lock in the location (don’t click the mouse at the location). Zen will capture the screen coordinates.
6. Try it out. Click “Test the Integration” an Zen will attempt to launch a ticker
7. Did it work? If AAPL launched in your chart, you are all set! If not, here are a few things you can try:
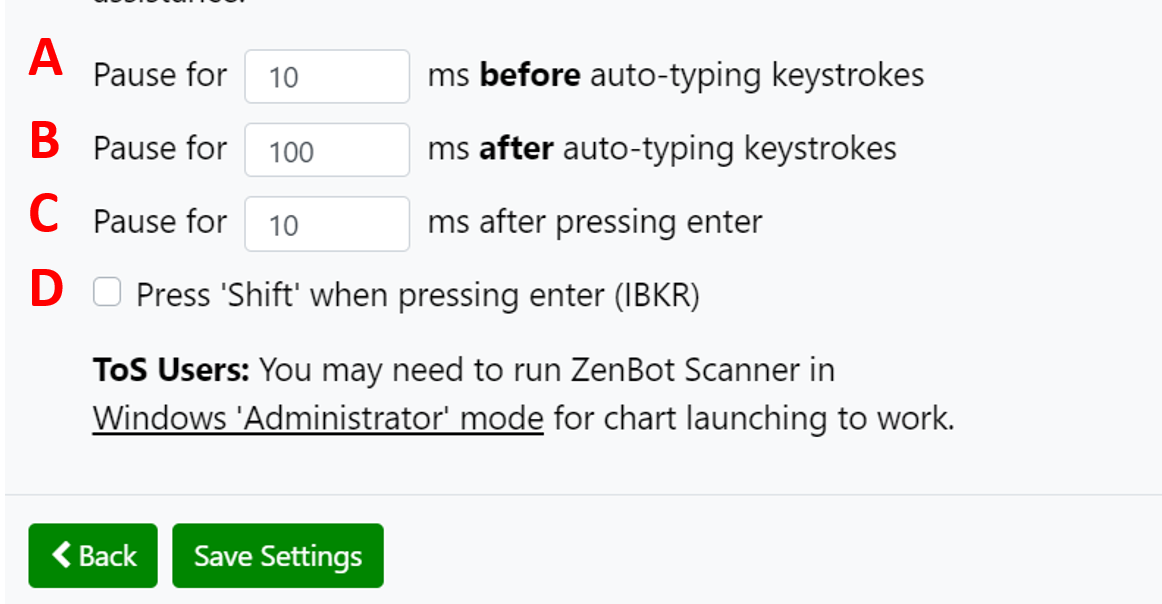
- A: If the symbol is not being typed properly – try adjust the length of time Zen waits before typing keystrokes. Based on the speed of your computer and your chart app, a longer delay may be required. Try increasing this value to 1000 ms or higher.
- B: If the symbol is typed correctly but the chart doesn’t launch – try increasing the time Zen waits AFTER auto-typing keystrokes (before it presses Enter).
- C: If the chart still doesn’t open, try increasing the time Zen waits after pressing the ENTER key
- D: Some platforms like IBKR require the SHIFT+ENTER keys to be pressed after entering a symbol. Check this box to enable the SHIFT key combo.
- ThinkOr Swim users: You may need to run ZenBot Scanner Windows ‘Administrator Mode’ so it is granted permission to click and enter keys.