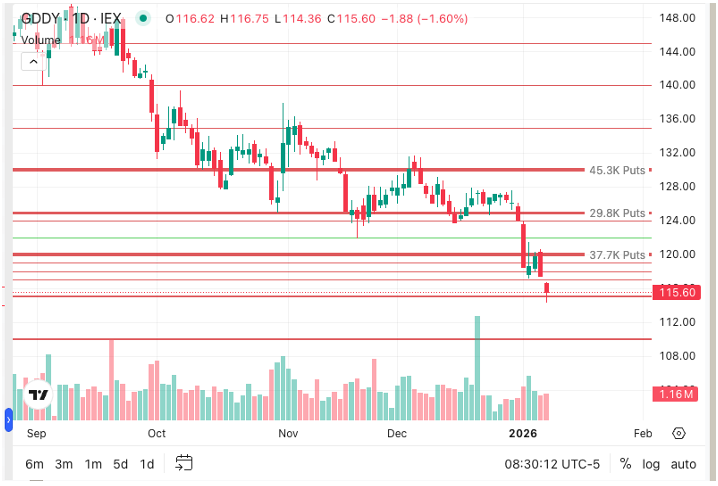
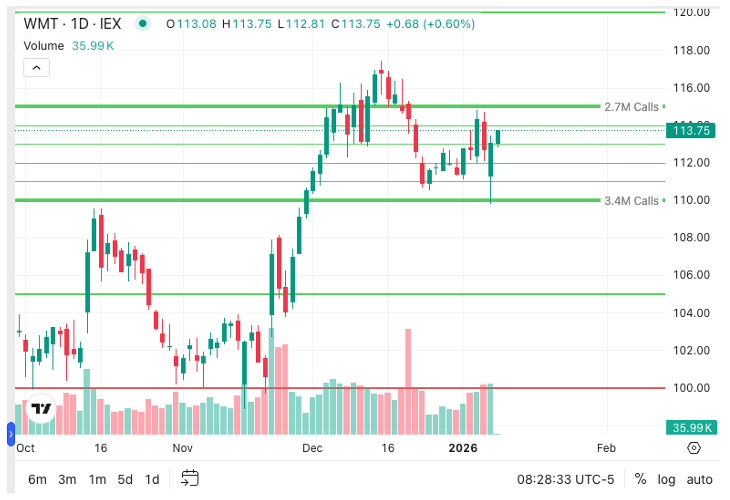
I’m launching a new feature today – price targets and support/resistance levels. You’ll now see see green lines indicating large “call walls” which act as targets and support levels. Red lines are “put walls” which act as resistance levels (or targets, if you are shorting).
I’ve been using option open interest levels as support and resistance levels. Last year I launched the options flow scanner to show the bullish/bearishness of a stock given the open option interest. Price tends to use the options levels as a ladder, climbing toward large levels of calls, or falling toward large levels of puts.
Bullish Call Walls
Notice the range between the two call wall levels. I’d take a long near the 110 call level and target the 115. If price broke above 115 and stabilized, I’d target 120.
Bearish Put Walls
Notice the three large put levels at 120, 125, and 130. As long as that selling pressure is there, price will keep falling. I’d enter on a pullback to 120 and short down toward 110.