
For the last few years I’ve been working and trading using a custom predictive trend indicator which I’ve dubbed ZenTrend. ZenTrend attempts to plot the cycles that occurs as price cycles between the top and bottom of a channel. This works REALLY well and is quite often a predictor of a future bullish or bearish trend.
Today I’m adding this indicator to ZenBot Scanner charts.
- Price is turning bullish when the red signal line curves upward and crosses the blue line.
- Price is bearish when the red signal line curves down and crosses under the blue line.
A few more tips
- Where does the cross occur? Crosses high above or below the ‘zero line’ indicate a more extreme change in price channel slopes.
- Flat lines: crosses that occur while the lines are flat often indicate chop.
- “Curve” of the line – a cross that occurs as the slope lines are starting to curve up/down indicates a sharper and more extreme change in price channel slope and a stronger trend.
How does it work?
It’s a secret. Just kidding.
Since the beginning I’ve open-sourced ZenTrend as a TradingView script. https://www.tradingview.com/script/ejF1HAxX-ZenTrend-Price-Cycles/ The indicator plots a fast (35-period) and a slow (100-period) linear regression channel and plots their slopes on an oscillator. When the slope of the fast channel crosses above or below the slope of the slow channel, a signal is plotted.
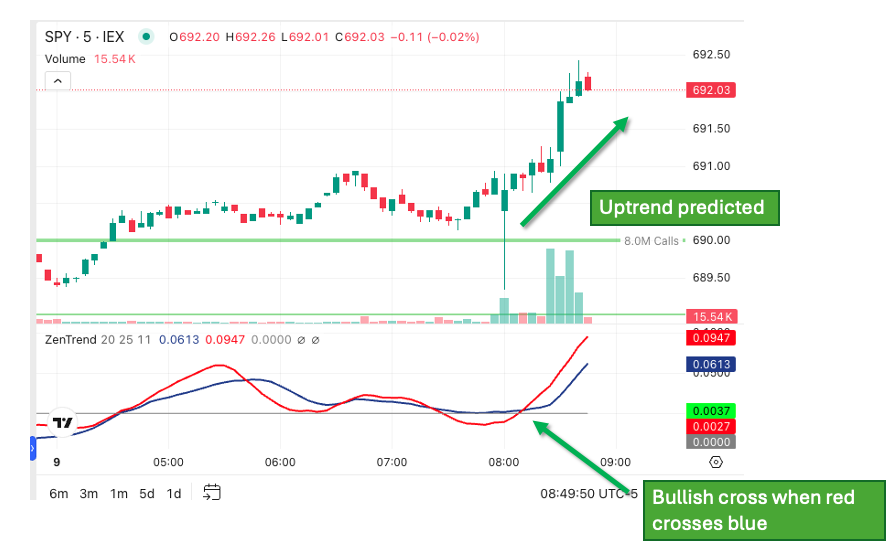
Bullish signal when the red signal line crosses the blue line
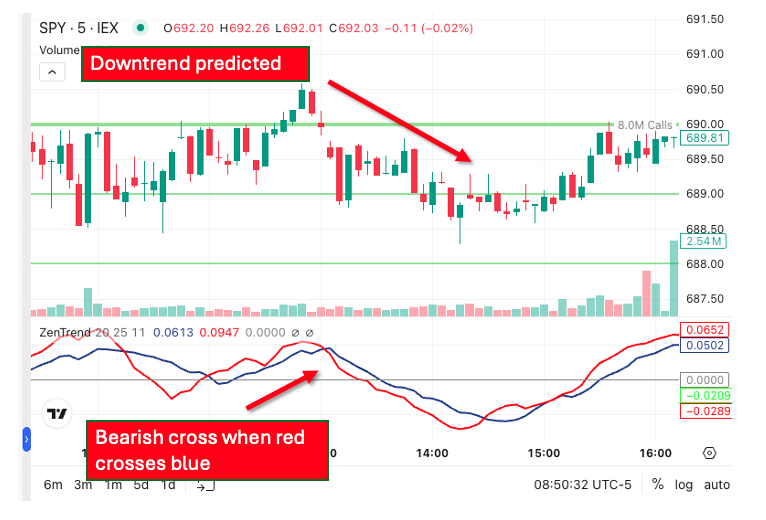
Bearish signal when the red signal line crosses under the blue line