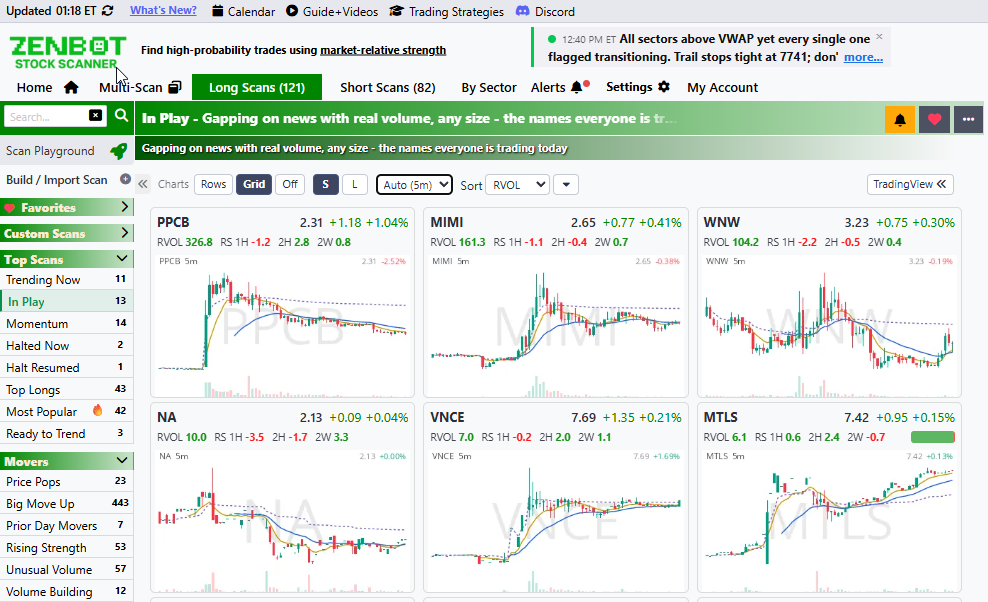
The loop every scanner user knows: run the scan, click the first symbol, look at the chart, go back, click the next one. Forty rows, forty round trips. The scan tells you what passed; the chart tells you whether you care. Until now those were two different places.
Now, every scan can show you the charts right in the results.
Two ways to see them
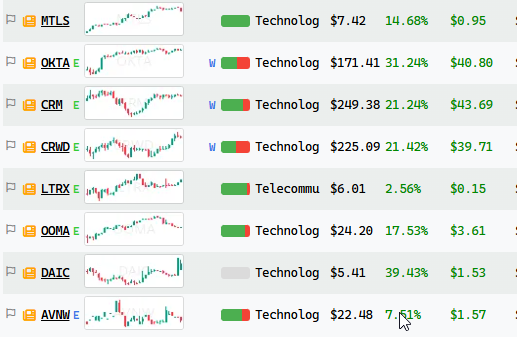
Rows puts a chart thumbnail beside every row — the scan you already use, now with a picture. It’s on by default. If it’s not for you, one click on Off in the chart bar puts everything back the way it was.
Grid is the one I’m excited about: the whole scan as a wall of charts, Finviz-style. Every card shows last price, dollar and percent change, RVOL, relative strength on three horizons (1H / 2H / 2 weeks), and the options-flow ratio bar. Click a card to open the full chart. The grid scrolls through the entire scan — no pagination, and it stays fast even on 300-symbol scans.
The timeframe follows the scan
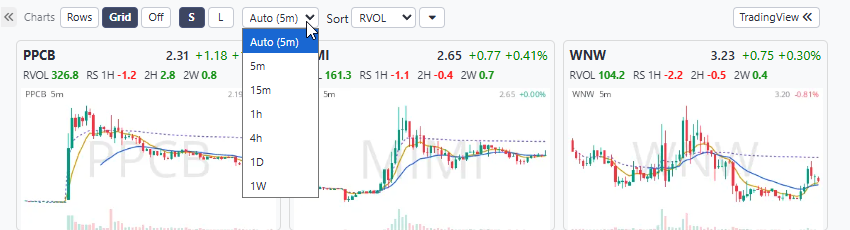
The chart bar has a timeframe picker — 5m to weekly — but the default, Auto, reads the scan itself. A scan built on daily filters previews daily charts; an intraday momentum scan previews 5-minute charts. If your scan uses multi-timeframe filters, Auto looks at which timeframes the filters actually reference and picks the one you expressed the most interest in. You can always override it.
Hover any symbol, in the grid, the rows, even search results — and you get a bigger chart in the tooltip, along with the usual stats.
Free and Turbo
Everyone gets chart previews. On the free tier the row view shows every chart with 15-minute-delayed data, and the grid unlocks the first two rows of cards. ZenBot Turbo makes every chart live and unlocks the full grid — the same real-time data that drives Turbo scans and alerts.
Open any scan and hit Grid in the chart bar. It’s the fastest way I know to triage a scan.