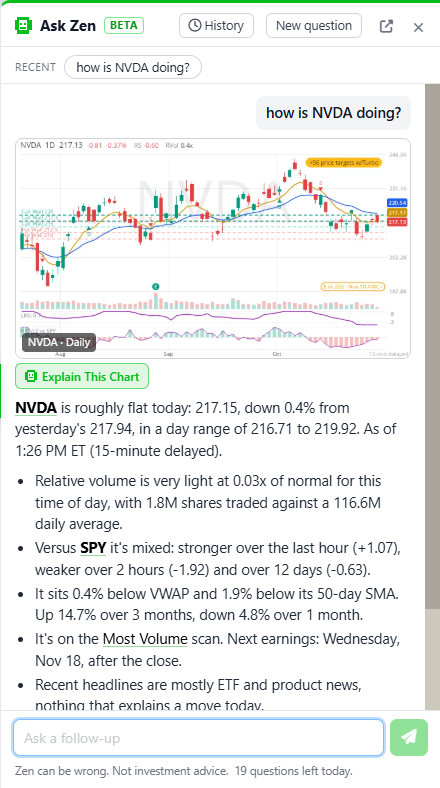
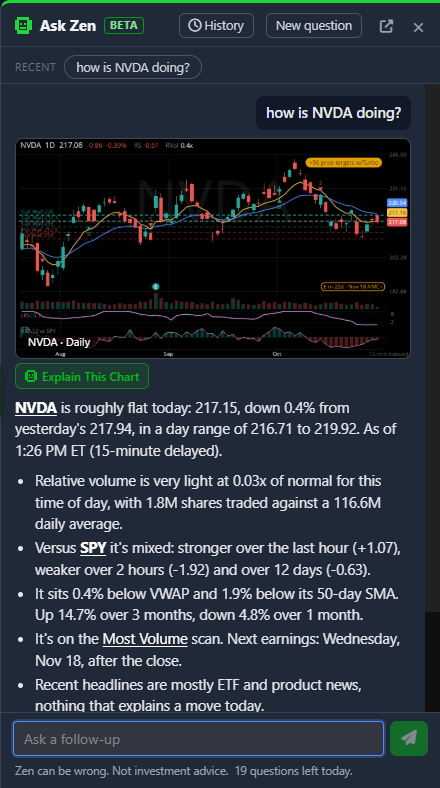
This is the one I have been most excited to ship. ZenBot now has an assistant, Zen, and it is not a chatbot bolted onto the side. It reads the scanner. Ask how NVDA is doing and Zen does not tell you what it remembers about NVIDIA; it looks at what the scanner sees this minute, the price and move, relative volume, relative strength against SPY, the scans the stock is on right now, the next earnings date, the headlines, and answers in a few lines with the chart. It is live for everyone today, signed in or not, and it is already the fastest way to get around ZenBot.
Build a scan by describing it
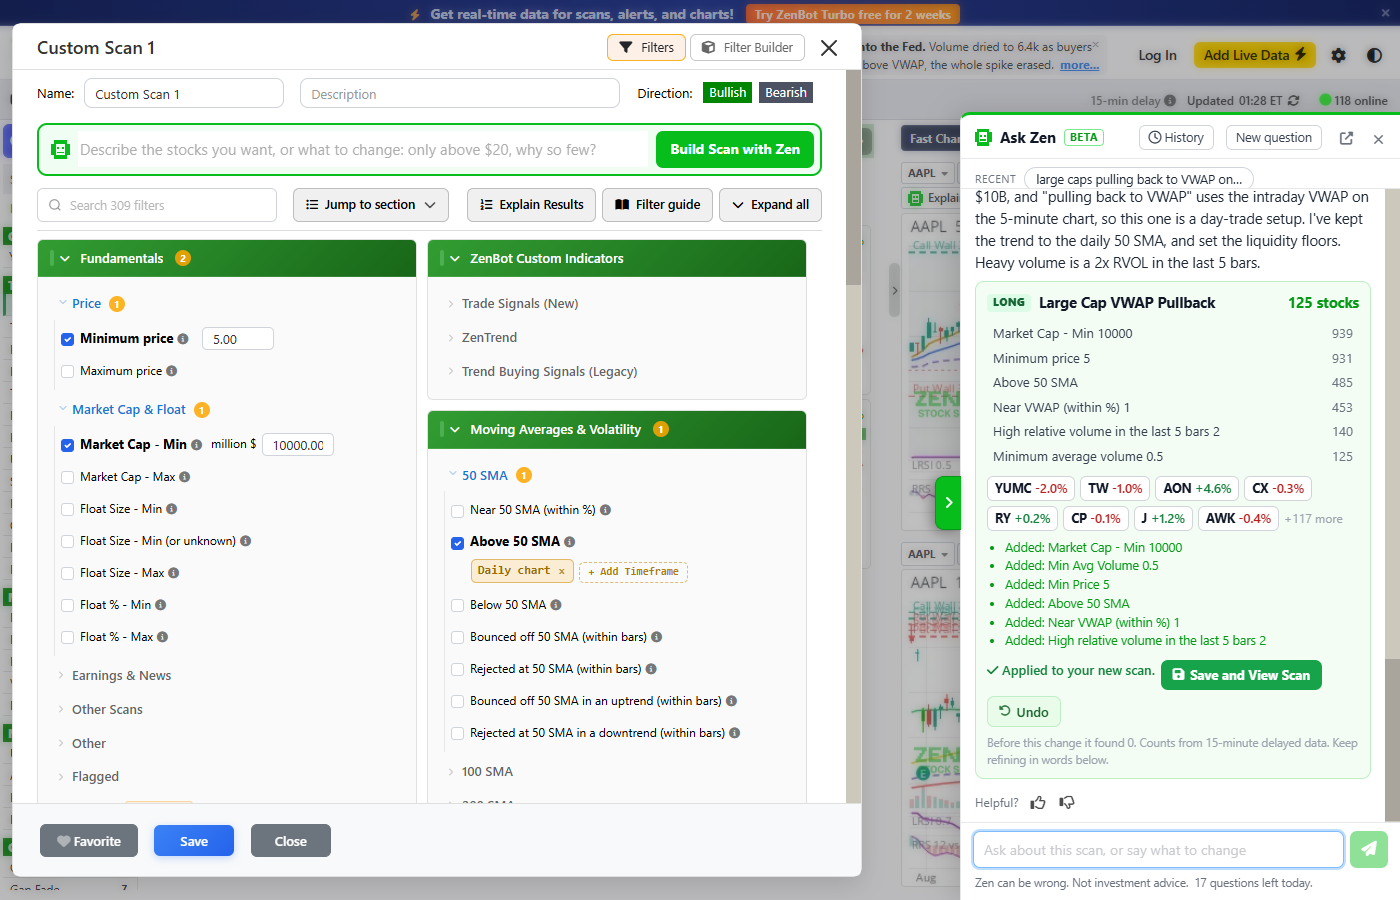
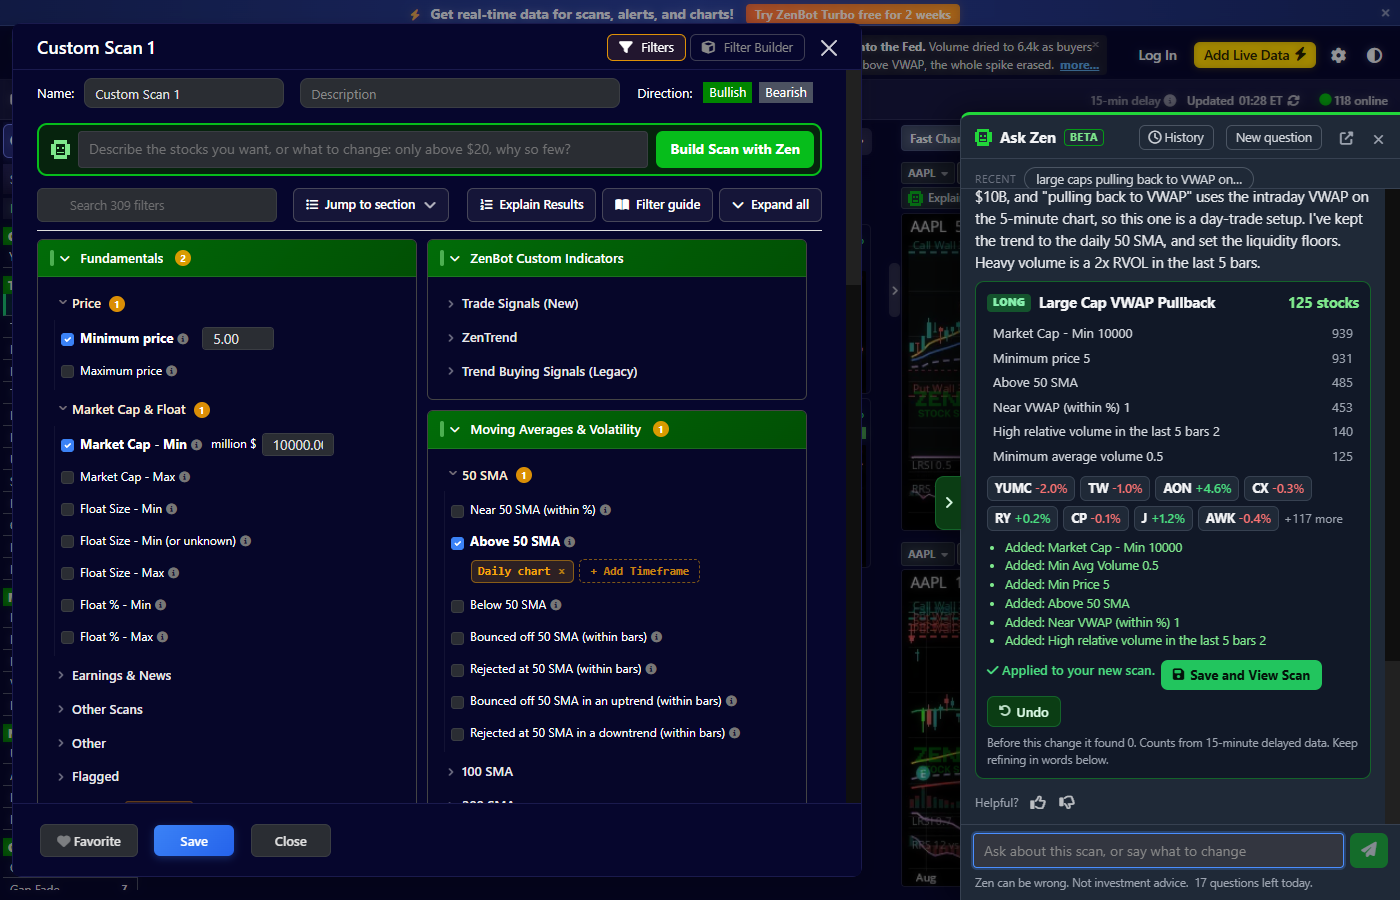
This is the part people are going to love. Click Build with Zen and type what you want in plain words: large caps pulling back to VWAP on heavy volume, small floats gapping up on news, stocks on my Breakouts that are also on Top Longs. Zen turns it into a real scan, runs it on the spot, and shows every rule with how many stocks pass it. Not quite right? Say so: only above $20, looser, same but shorts. Press Save and View Scan and it is yours. Open any existing scan’s filters and the same box is at the top, so add a group: up 3% or gapping up shows the changed scan with the counts before and after and waits for Apply to scan. Undo puts it back. Years of building scans by hand and this still feels like a trick.
Have a chart read to you
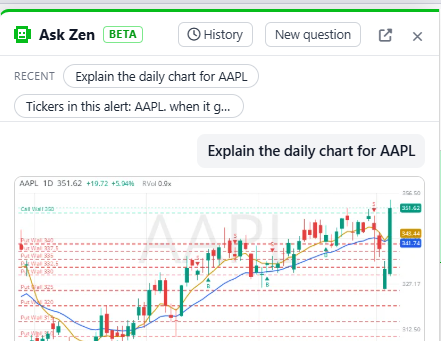
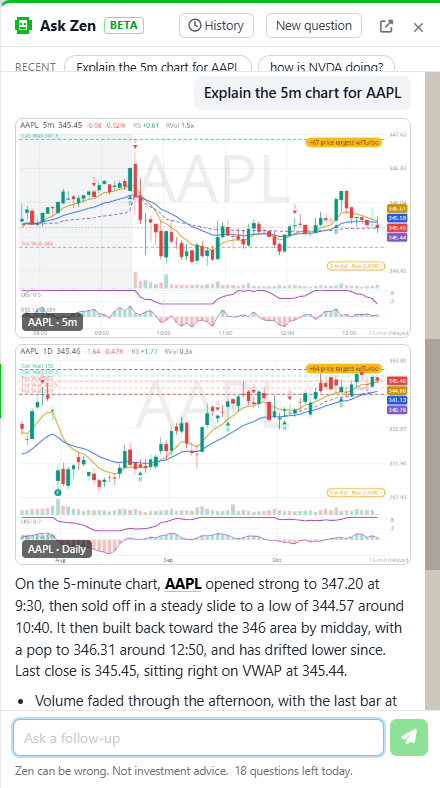
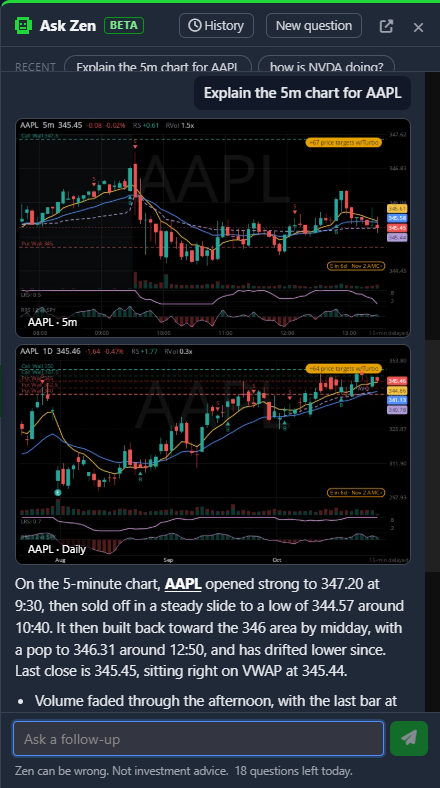
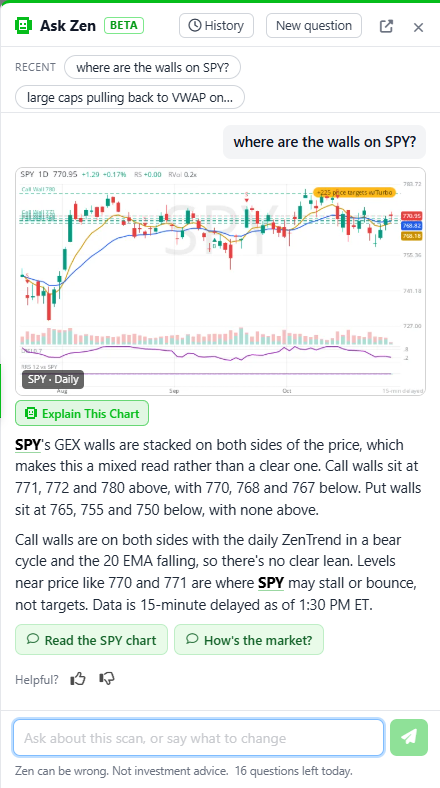
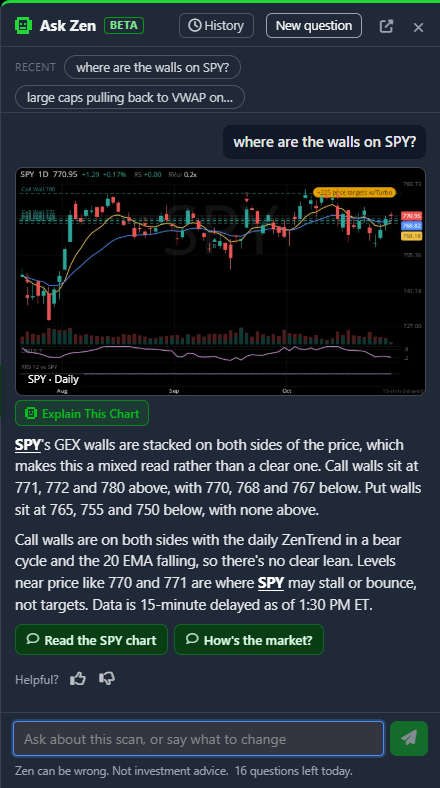
Press Explain Chart above any Fast Chart and Zen describes the trend, the key levels and the volume on that timeframe and the next one up, with the numbers behind every claim. If the chart draws options walls, Zen reads them the way I trade them: call walls both above and below the price with a healthy daily uptrend lean bullish, puts stacked above lean bearish, mixed walls are no read and it says so. Ask where are the walls on SPY? and you get the same read on demand.
Ask it anything the scanner knows
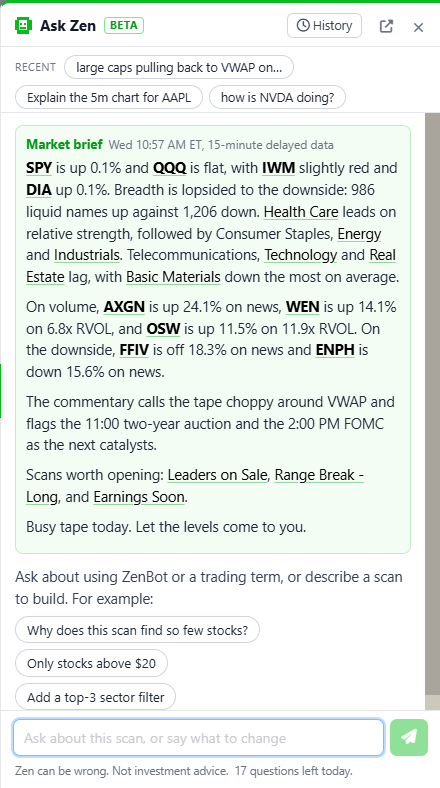
is the flow bullish on TSLA? gets the delta exposure split, the positioning read and the next major levels. is AMD extended? gets RSI, MACD, ADX, squeeze and distance from the moving averages on the 5-minute and the daily. why was X halted?, short interest on GME?, did AAPL beat?, when does NVDA report?, what's on the calendar this week? all work. Right-click any ticker in a scan and choose Why is it on this scan? and Zen checks every rule against that stock. Open the panel with nothing in it and Zen’s brief is already waiting: where the market stands this session, the sectors, the movers, the scans worth opening. What's interesting right now? gets the same read any time.
It knows you
Zen sees your own scans by name with how many stocks each holds, so how many stocks are on my Breakouts scan? just works. It sees your alerts too: alert me when something hits Momentum answers with a button that does exactly that, and what alerts do I have? lists them. Alerts on a single stock work the same way now: alert me when NVDA crosses 200 prepares the condition, the stock and the settings, and a button opens it in the alert dialog for you to check and create. Inside that dialog there is a Build with Zen box too, so above the 20 EMA with RSI under 30 in plain words fills the form, with Undo. And when Zen names a stock you already have an alert on, a bell sits beside it. Every question you have asked is in History on the panel, with Open scan, Rebuild and Continue on the ones that built something, and the strip under the box keeps your recent ones a tap away.
What it won’t do
Zen describes; it never advises. No entries, targets, exits or predictions, and it will tell you so if you ask. Its numbers come from the scanner, but the words are its own and it can be wrong, so check the chart before you act. There is a thumbs up and a thumbs down under every answer. Use them. They reach me, and most of what shipped in Zen’s first week came straight from them.
Where to find it


- The green Ask Zen tag in the search box, and the Zen tab on the right edge of the screen.
- Build with Zen in the left menu, and the box at the top of the filter editor.
- Explain Chart on every Fast Chart, including chart windows.
- The Build with Zen box in the Create alert dialog.
- Right-click a ticker or a scan.
- On a phone, the search box with the Ask Zen tag runs across the top.
Questions per day
| Questions a day | Data Zen sees | |
|---|---|---|
| Signed out | 20 | 15-minute delayed |
| Free account | 20 | 15-minute delayed |
| ZenBot Turbo | 100 | Live |
A typed question and a chart read each count as one; the buttons under an answer are free. Signing up is free and takes a minute.
Go ask it something. The guide has the full tour: Ask Zen.