Big update. Probably the biggest one ever, so grab a coffee.
Back in August I wrote about the loop every trader knows: run the scan, click a name, look at the chart, go back, click the next one. The scan tells you what met the criteria. The chart tells you whether you care. I’ve spent the two months since trying to kill that loop completely.
Now you can see a whole scan as charts, open any chart without waiting, and get the chart sent to your phone with the alert. Around that there are new scans, a pile of new filters, one search box for everything, and a long list of fixes. A lot of it came straight from your emails and Discord messages, so thank you, and keep them coming.
Here’s the tour, biggest first. Jump to whatever catches your eye:
- Scan results as a wall of charts: every ticker in a scan as a chart
- Fast Charts: Zen’s own instant charts
- Chart windows: up to eight charts in one window, linked and saved
- Trade Signals: Buy and Short markers on the chart, as a scan and as a filter
- Super Search: one box for tickers, scans, filters and settings
- Save your filters: name a filter and use it on any scan
- Scan Explainer: see why a scan is short, one condition at a time
- Right-click menus: everything for a ticker or scan in one click
- 65 new filters: opening range, anchored VWAP, moving average bounces and more
- Mobile alert charts: a chart with every Telegram and Discord alert
- Also new: new scans, linked windows, Scan Playground, speed
- The rest of what’s new and what got fixed
Scan results as a wall of charts
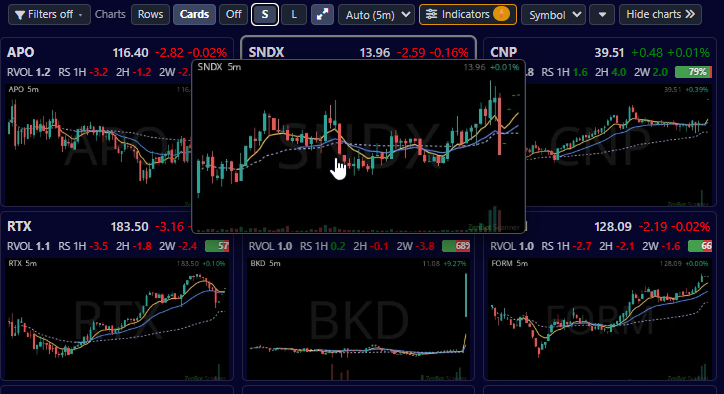
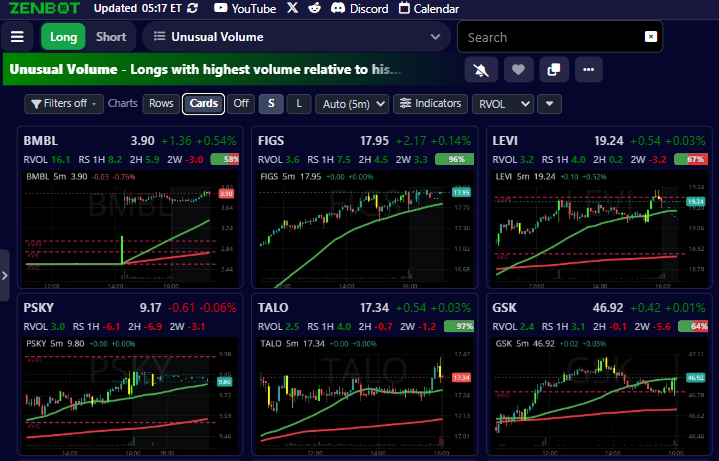
This is the one I’m most excited about. Flip any scan to Cards and every ticker becomes a chart. Pick Rows and you get a small chart beside each name. Forty results used to mean forty clicks. Now it’s one scroll, and your eye does the sorting.
- Hover over a preview to expand it. Rest the pointer on a chart for about a second and a bigger one opens. Not a fan? There’s a button on the chart bar to switch it off.
- One switch changes the timeframe for the whole wall. Or leave it on “Auto” and it picks the timeframe from the scan’s own filters, so a daily scan shows daily charts.
- Large or small previews. Toggle between both modes. Personally I collapse the left and right columns and use large previews which stretch full screen.
- Arrow keys move through the cards, both directions, and the selected card scrolls into view.
- Turbo traders can customize the chart indicators on previews, separately from their main charts. See everything you need, at a glance!
Fast Charts
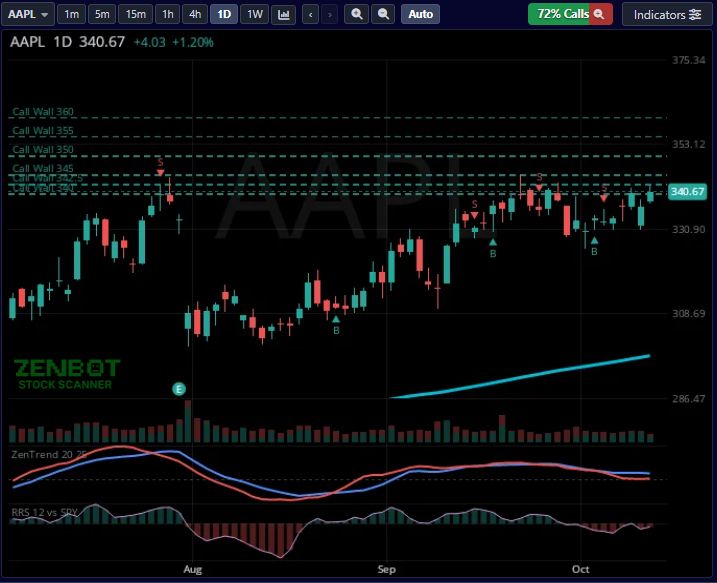
Zen has its own charting engine! Click a ticker and the chart is just there. No loading, no spinner. Click the next one, and the next. That’s the whole idea.
I love the TradingView charts, and they aren’t going anywhere. But when you’re working through a scan you aren’t studying one chart. You’re flipping through thirty of them, and every second of “loading…” adds up. Fast Charts are built for exactly that job.
Why you might use them instead of TradingView:
- They’re instant. You can go through a whole scan about as fast as you can click or press the arrow keys.
- The useful stuff is one click. No digging through an indicator list for the things you check on every chart.
- They show what Zen knows. This is the big one. Because the engine is ours, I can draw Zen’s data on them the way it should look:
- Options levels. The call walls and put walls, right on the price chart, so you can see where a move is likely to stall or find support.
- Relative Strength against SPY.
- ZenTrend, so you can see where price sits in its cycle.
- Trade Signals. The Buy and Short markers, on the bar where they fired.
- They’re easy on your computer and work great on mobile. Open six chart windows across two monitors and nothing slows down.
- They power everything else. The same engine draws the chart previews on your scans and the charts in your Telegram and Discord alerts. That wall of charts up top? Fast Charts. The chart that lands on your phone with an alert? Fast Charts. So what you see in one place is what you see everywhere.
What you can do with them now:
- Scroll back and zoom. Drag the chart or use the mouse wheel. “Now” brings you back.
- Any timeframe, from 1 minute up to weekly.
- See real strength. The new Relative Strength indicator compares the stock to SPY. Is it actually strong, or just riding the market? Now you can see it.
- Anchored VWAP in one click, from the last earnings, the quarter, the start of the year or the last 52 weeks.
- Earnings and splits marked on the chart. A green “E” for a beat, a red one for a miss.
- Buy/sell volume. Each volume bar shows roughly how much was buying and how much was selling. It’s an estimate, not exchange data, but it makes the big climax bars jump out.
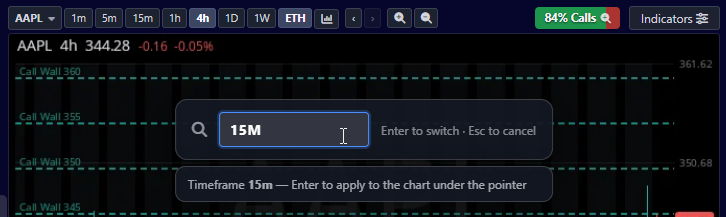
- Just type. My favorite. Put your mouse over a chart and type a ticker or a company name. Type “15” or “1D” to change the timeframe.
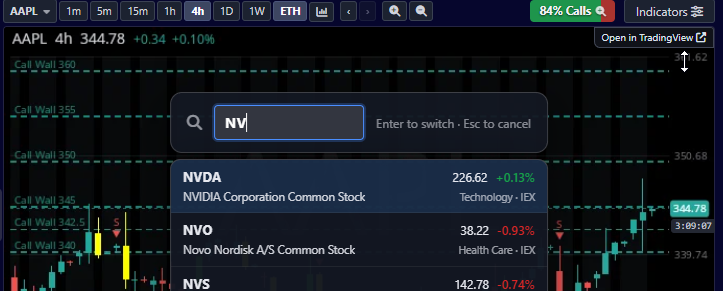
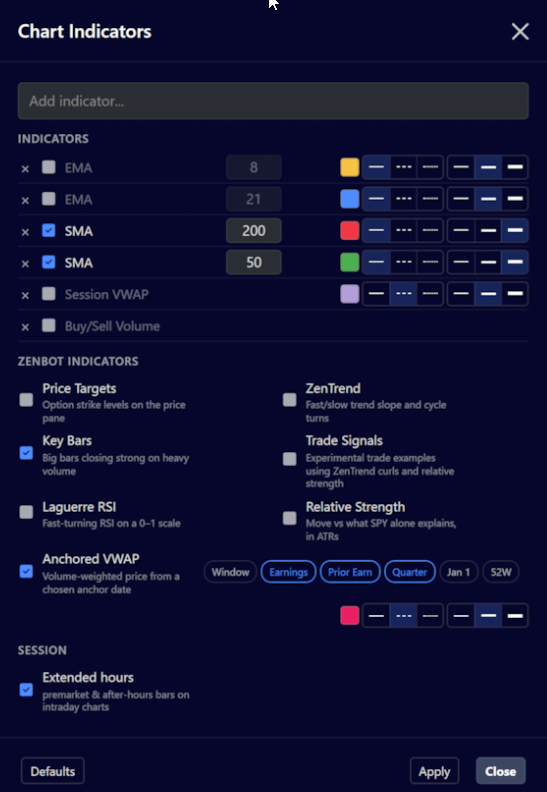
- Your favorite indicators are there too: Bollinger Bands, Keltner Channels, SuperTrend, Ichimoku, Volume Profile, RSI, MACD, TTM Squeeze and more.
When TradingView is still the better pick: drawing trendlines and levels, and when you want to sit with one chart and really study it. It’s one click away from any Fast Chart, and you choose which one opens by default. I use Fast Charts to go through the scan and TradingView for the two or three names I actually want to trade.
Multi-Chart Windows
Open a chart in its own window (right-click any ticker, then Open chart in new window, or look for the pop-out button) and it’s no longer one chart. It’s a workspace.
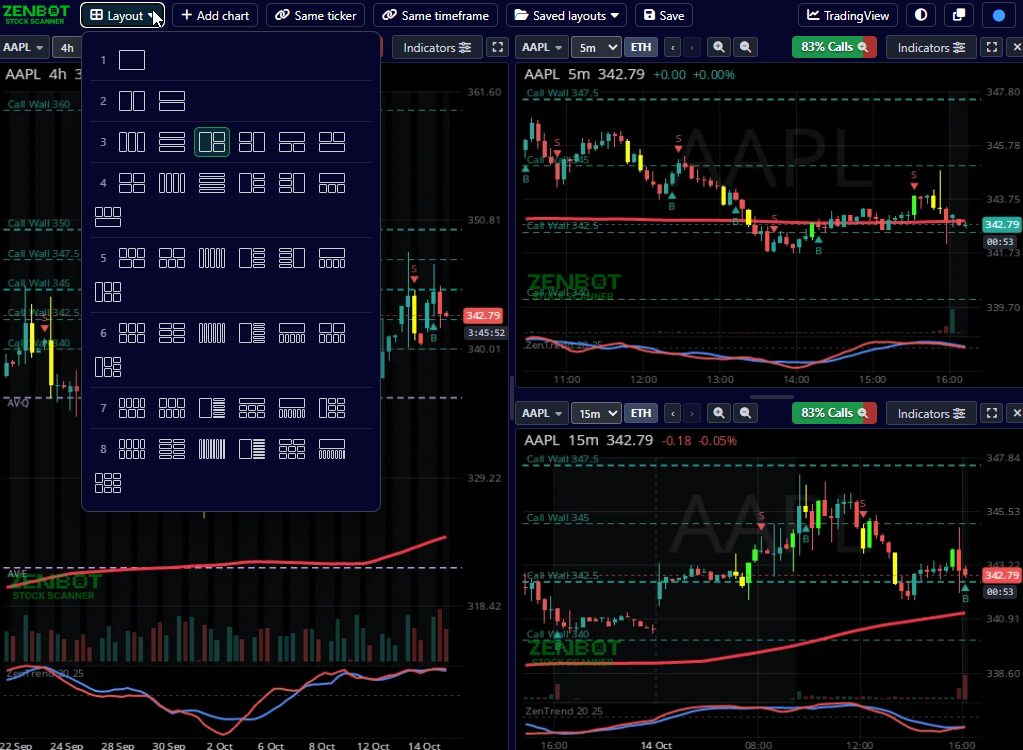
- Up to eight charts in one window. Pick how many and how they’re laid out from the button at the top left: side by side, stacked, a grid of four, all the way to eight. Drag the lines between charts to resize them, and double-click a line to even them out. Free or Turbo, everyone gets all eight.
- Each chart has its own ticker and timeframe. Move across one and the crosshair follows on all of them, so you can line up the same moment on the 5-minute and the hourly. The date and prices show on the chart under your pointer.
- Same ticker and Same timeframe. Two switches on the window’s bar. Same ticker puts every chart on one stock, so one stock on four timeframes. Same timeframe does the reverse, four stocks on one timeframe.
- TradingView in every chart. One click flips every chart in the window to TradingView, same layout, so you can draw. Click Fast Charts to flip back.
- Saved layouts. Name a layout and it’s in the Save menu next time, on any computer you sign in on. Changes save themselves as you go, and the first chart window you open comes back the way you left it.
- Link it by color. Give the window a color and it follows your scan. More on that below.
Small charts stay tidy, too. When a chart gets narrow, its toolbar drops the extras and keeps the ticker, timeframe and indicators.
Trade Signals
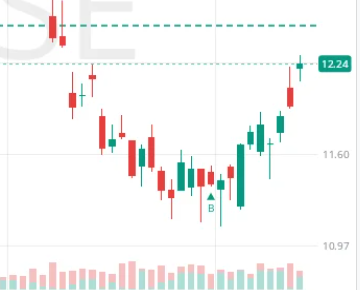
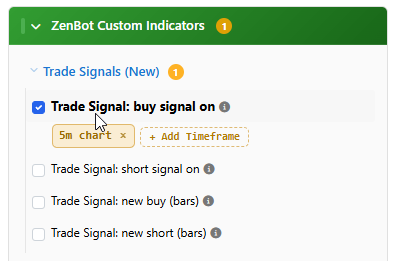
This one’s a pretty neat addition, and it now runs through the whole app. Zen can mark trade ideas right on the chart: a Buy or a Short on the bar where the setup triggered, and then where that trade would have ended. You don’t have to imagine how it played out. It’s drawn for you.
Quick disclaimer before anything else: these are experimental trade examples, not recommendations. I use them to find charts worth a look. Then I do my own homework, and you should too.
How they work on the chart
- On the 5, 10 and 15 minute charts Zen looks for a pullback in a stock that’s already moving. The stock is trending and on the right side of VWAP, it dips for a couple of bars, then it turns back the way it was going. That turn is the signal. It works both ways, so you get Buys and Shorts.
- Only real movers qualify. The stock has to be trading well above its normal pace with real dollar volume behind it. A sleepy stock drifting around doesn’t get a signal.
- Every signal comes with an exit. A target, a stop, or the end of the day, whichever comes first. The chart shows how each one turned out, win or lose.
- On the hourly and daily charts the signals are trend entries, and they’re Buys only. They also wait for the market itself to be heading up.
- Intraday signals run from 9:45 to 3:55 ET. Nothing fires in the opening chaos.
Turn them on from the Zen Indicators menu on any chart. They work on Fast Charts and on TradingView.
New scans: show me who just got a signal
A marker on a chart is nice. A list of every stock that just printed one is better.
- Has Trade Signal, Long. A Buy fired in the last 5 bars on the 5 minute up to the 1 hour chart.
- Has Trade Signal, Short. A Short fired in the last 5 bars on the 5, 10 or 15 minute chart.
- Daily Trade Signal. A Buy on the daily chart in the last 5 days. You’ll find it under Trend, next to Strong Daily.
Try this: open Has Trade Signal, flip it to Cards, and you’re looking at a wall of charts that all just triggered. That’s about as fast as idea-hunting gets.
New filters: add a signal to your own scan
The same signals are filters now, so you can mix them into anything you build.
- Buy signal on / Short signal on. The chart is in an open trade right now.
- New buy / New short. The signal fired within the last few bars. You choose how many.
Pick the timeframe like any other filter. Buys work from 5 minutes up to daily, Shorts on 5 to 15 minutes. So “a new Buy on the 15 minute, above the 200 SMA, with high relative volume” is a scan you can build in about a minute, and then put an alert on.
Super Search
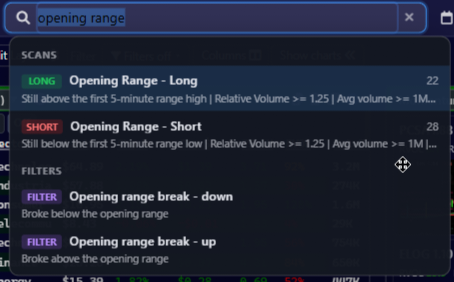
Zen has grown a lot of screens, and I got tired of hunting for things in my own app. So press / and start typing. Tickers, scans, filters and settings all come from one box.
- A ticker shows its price, today’s move, which scans it’s on right now, and whether it has news.
- Shorthand works. “orb” finds Opening Range. “semis” finds the sector. “rvol” jumps to the relative volume filter.
- Settings and help are in there too: alerts, the calendar, dark mode, the guide.
- A chart and the latest headlines sit beside the results.
If you can’t find something, press slash and ask for it.
Save your filters
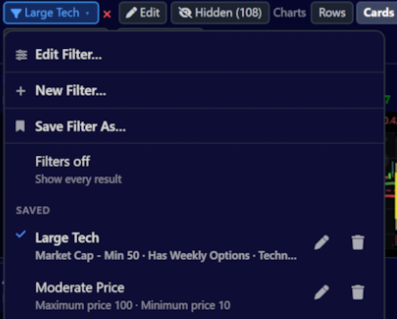
Build a filter once, name it, and it’s yours. There’s a Filter button above every scan now. It shows what’s applied and lets you jump between your saved filters, or switch them off in a click.
- They work everywhere: Long, Short, sector lists, your own scans and Multi-Scan panels.
- Recent filters are one click to restore.
- Duplicate a saved filter to tweak a copy.
- “Hidden” shows the rows your filter is hiding, so you always know what you’re not seeing.
Scan Explainer
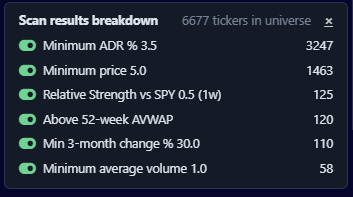
You build a scan, and it comes back with three names. Or none. Why? I get this question a lot, and I ask it myself.
Hit Explain and watch the list narrow, one condition at a time. The count is right up front, for example “59 of 6,665”.
- Switch any condition off right there and see what comes back.
- Click a row to edit that condition.
- An empty scan offers to show you which condition removed everything.
- It works on Filter Builder scans, nested AND / OR groups included.
Right-click menus
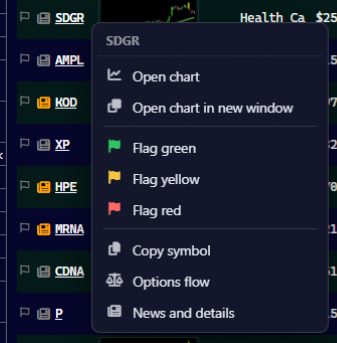
This one’s overdue. Right-click any ticker or scan and everything is right there. Open its chart, here or in a new window. Flag it green, yellow or red. Copy the symbol, or jump straight to options flow and news.
Right-click a scan in the sidebar to open it in a new window, add it to Multi-Scan, switch its alerts, share it or edit it.
65 new filters
Yes, 65. Mix them into any scan. Here are the ones I’d look at first:
- Trade Signals. An open Buy or Short, or one that just fired. More on these above.
- Opening Range Break, up or down.
- Anchored VWAP.
- Multi-Month Momentum. Change over 1, 3 and 6 months.
- Option-Based Support Bounces.
- Bounced off or rejected at a moving average. Price tested the 8, 21 or 50 EMA, or the 50, 100 or 200 SMA, and closed back on the side it came from. You choose how recent.
- Bollinger Bands. Price above the upper band or below the lower band.
- Slow Stochastic 34/10/3. Above or below a level, and above or below its signal line. One of you asked for this, right down to the settings. Done.
- Recent volume bursts. At least one of the last 3, 5, 10 or 20 bars traded a multiple of normal volume. On the daily chart this finds stocks that were recently in play.
- Gaps. In or near a gap.
- Splits. Recent split, upcoming split, or no recent split.
With that many filters, the dialog needed some love too. Search comes first now: type and it lists matching filters with what each one does.
Mobile alert charts
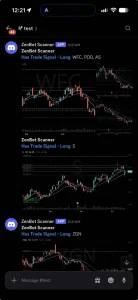
Telegram and Discord alerts now show up with a chart of the stock, on the timeframe you choose, and a link straight back to the scan. You see the setup before you even open the app.
- You pick the timeframe in Alert Settings, from 1 minute to weekly.
Also new
New scans
- Opening Range, Long and Short. Stocks still trading beyond the first 5-minute range of the day on above-normal volume. Don’t panic if it’s empty before 9:35 ET. There’s no range until then.
- Bull Flag and Bear Flag. Sharp 5-minute move, then a tight 3 to 10 bar pause that gives back less than half of it, on lighter volume, on the right side of VWAP.
- Has Trade Signal, Long and Short, and Daily Trade Signal. See the Trade Signals section above.
Link windows by color
If you run a few monitors, you’ll like this. Give each pop-out a color. Pick a stock and only the windows of that color follow. Put your scan and its chart on blue, and leave your SPY chart on “Not linked” so it never moves. Each pop-out keeps its own timeframe, view, indicators and filter.
Scan Playground
Not sure where to start? Answer four quick questions and you get the scans that fit how you trade. It’s in the Learn menu, or open it here.
Time in scan results
A new Time column shows when each stock joined the scan. It’s on by default. You can change it in the column picker, which now opens from a gear in the column header.
Speed improvements
Everything should feel snappier:
- The app shows up sooner, with placeholder rows while data arrives.
- Clicks respond right away. The row highlights and the chart starts drawing first.
- Charts swap without a flash.
- Tabs you aren’t looking at take a rest, and catch up when you come back.
The rest of what’s new
Top bar and menus
- A shorter top bar. The logo goes Home. Account, Settings and the dark / light switch are in the corner.
- A Learn menu with Trading Strategies, the User Guide, Scan Playground and What’s New.
- A Support menu with Contact Support, Make a Suggestion and Report a Problem. Reports can include a screenshot, captured in one click.
- A new Market Calendar: an agenda by day, Eastern times, with forecast and previous values.
On your phone
- New navigation: a side drawer, a one-tap Long / Short switch, and the scan list as a sheet from the bottom.
- The page no longer scrolls sideways. Finally.
- Tap a preview chart to open the full chart, full screen.
Pop-out windows
- Clone a chart window in one click.
- Pop-outs remember their size.
- Dark or light mode switches every open window at once.
Filter Builder
- Built-in help with a worked example, and a “Build this example” button.
- 65 conditions that used to return the whole list now filter properly.
- A scan that can’t be run returns nothing and tells you why. It used to return every stock, which helped nobody.
Scans
- VWAP Pullbacks is stricter. The stock must have run at least 1.5% from VWAP, come back to within 1% of it, and still be strong against the market.
- 4-hour and 8-hour values now include premarket and after-hours, so they match the charts.
- Stocks are held out of built-in scans on a split day, so a split doesn’t show up as a fake 90% drop.
- Every built-in scan has its own public page at zenbotscanner.com/scans, easy to bookmark or share.
Your account
- Manage your plan from My Account: update your card, download invoices, or pause for one to three months.
Fixed
Thanks to everyone who reported these. Here are the ones you may have noticed:
Charts
- “Open in TradingView” sometimes opened a different stock. Oops.
- Daily and weekly Fast Charts could be a day or two behind.
- Recent IPOs showed “No chart data”.
- The crosshair kept the previous stock’s numbers after you switched.
- The 200-day average could be cut off the edge of the chart.
- Typing fast in the chart’s symbol lookup dropped letters.
Scans and filters
- “Near 200 SMA” on the 4-hour and 8-hour charts missed about two-thirds of stocks.
- Relative-weakness and earnings conditions in the Filter Builder ran as their opposite.
- “Recent EMA cross” on a timeframe only matched the bar that just closed. It now means the last 3 bars.
- RSI-below filters matched stocks with no RSI yet.
- Conditions you switched off in Explain switched themselves back on.
- In a pop-out, picking another scan changed the title but not the results.
Alerts
- Links in alerts to your own scans said the scan “isn’t on the server”.
- A stalled Telegram or Discord call could delay everyone’s alerts by over a minute.
- One rejected picture cost a Telegram alert all of its charts.
Search
- Search put the biggest company ahead of the exact ticker. Try F, T or ES now.
- Newer listings came back as “no symbol found”.
Layout and phones
- A saved layout could come back blank with several windows open.
- On phones, the filter picker and Indicators menu closed as soon as they opened.
- The header, scan picker and scan title overlapped on phones.
Windows app (these arrive with the next app update)
- Pop-out windows are remembered and reopen in the same places.
- Closing the main window closes the pop-outs and exits.
- External links opened twice.
Try it
If you only try one thing, open any scan and hit Cards in the chart bar. It’s the fastest way I know to triage a scan.
And if something’s broken or missing, tell me. Use Support > Report a Problem in the app, or find me on Discord. Half of this list started that way.
Happy trading!