
Something I noticed recently: a lot of the traders finding ZenBot Scanner are running some version of the Qullamaggie playbook. Enough of them that it stopped looking like a coincidence. So I built the scans out. Here they are, ready to use.
Who is Qullamaggie?
Kristjan Kullamägi — @Qullamaggie — is a Swedish trader who turned a small account into a very large one trading momentum swing setups, and then did something unusual with it: he published the whole method for free. His breakout, episodic pivot and parabolic short setups are documented in detail on his site and in hours of livestreamed trading.
The method has a following because it’s specific. He isn’t vague about what he’s looking for.
The style, in one paragraph
Find stocks that have already made a big move — the biggest gainers over one, three and six months. Wait for them to consolidate. Buy the breakout out of that consolidation, size it against a tight stop under the range, and hold the winners for weeks while cutting the failures immediately.
Two filters do most of the work, and both are easy to overlook:
- ADR (average daily range). He passes on low-ADR names no matter how good the chart looks. A stock that moves 1.5% a day can’t pay for the risk. Below ~3.5%, he isn’t interested.
- Relative strength. Up 30% in a bull market might be a laggard. What matters is beating the index, not rising.
The short side is the mirror image: a parabolic move that runs into a declining VWAP and declining moving averages, starts printing lower highs, and fails.
The scans
Momentum Leaders — the candidate pool. Up 25% in a month and 50% in three, outperforming SPY on both a one-month and a weekly basis, ADR ≥ 3.5%, $1M+ average volume. This is the watchlist, not a buy list — these names are what you check for consolidations. https://www.zenscans.com/custom/7e6a047c
52-Week AVWAP — the same strength requirement, plus price above its 52-week anchored VWAP. That level is roughly the average price everyone who bought in the past year paid, so above it the typical holder is in profit and rallies don’t run into trapped supply. A structural filter rather than a momentum one. https://www.zenscans.com/custom/00a128da
Breakout — the entry. A leader breaking a multi-day range to 20-day highs, above the 50 SMA, on above-average volume. This is the day something actually happens. https://www.zenscans.com/custom/68c36f4e
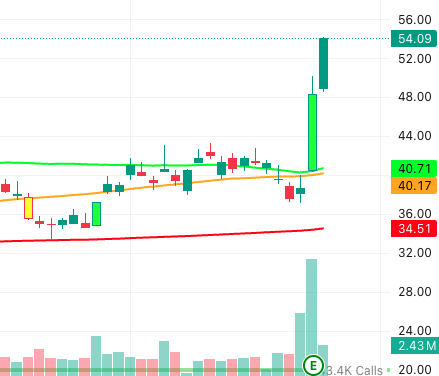
Episodic Pivot — the other entry. A gap up out of a base on heavy volume, usually news or earnings driven: up 8%+ on the day with RVol ≥ 2. Different trigger, same idea — a stock leaving its range with force. https://www.zenscans.com/custom/602634bd
Prior Day Movers — yesterday’s ±15% movers with real volume behind them. The rawest version of the candidate pool, and the one that needs no context to be useful. https://www.zenscans.com/custom/c0e8aee3
VWAP Fail Short — the short. Below VWAP with the 8-EMA under the 21-EMA, ADR ≥ 4%, on volume. The parabolic that ran into resistance and rolled over. https://www.zenscans.com/custom/0429fc98
A note on using them
These are starting points, not signals. The candidate scans are meant to be browsed — you’re looking for a chart in a tight consolidation, not buying everything the scan returns. Qullamaggie is explicit that most of his profit comes from a small number of trades held properly, not from taking every setup.
The thresholds are my reading of his published criteria, not numbers he handed out. Adjust them. That’s what the filters are for — every one of these is editable, and you can save your own version.
Try them
Load any of these from the scan menu, or clone one and start changing thresholds. If you run this style and something is missing, tell me in Discord — that’s where most of what ships comes from.