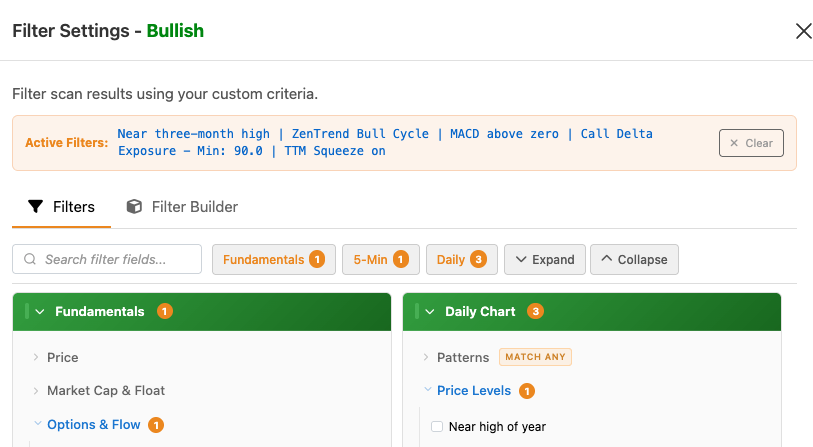
I’m happy to announce a number of new indicators are available for you to scan, filter, and add as columns. Most of the indicators are also available for the daily chart, and I’m working on bringing these to other timeframes. Many traders have asked for their favorite indicator – if you would like one added, pop into the ZenBot Discord channel or send a support email.
A new (and much easier) filter screen helps you find the indicators you are looking for. Search by name, or explore the groups like Daily Chart –> Trend & Momentum –> ZenTrend Bull Cycle.
Here are some of the new indicators.
- MACD
- Heiken Ashi reversal and continuation – “bars since”
- RSI – complements the existing Laguerre RSI
- TTM Squeeze
- AVWAP – earnings, prior earnings, quarter, year, 52-week
- ADR Average Daily Range
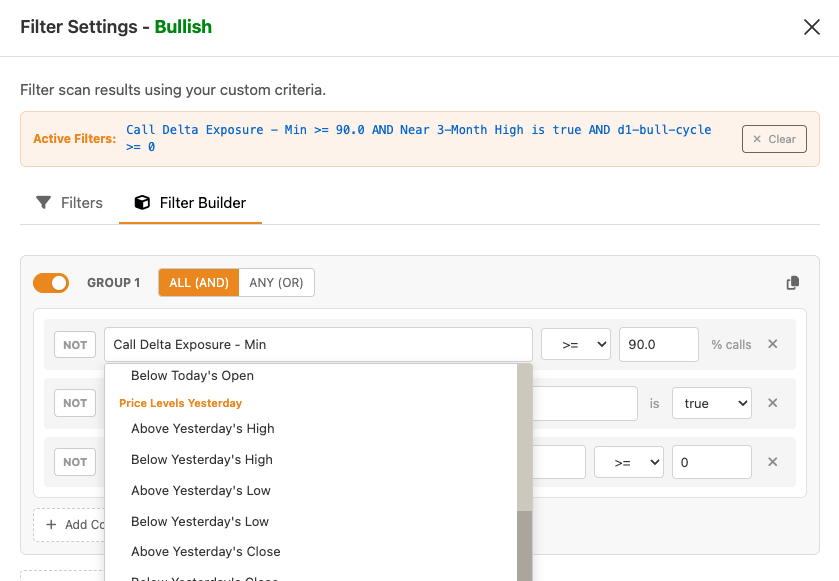
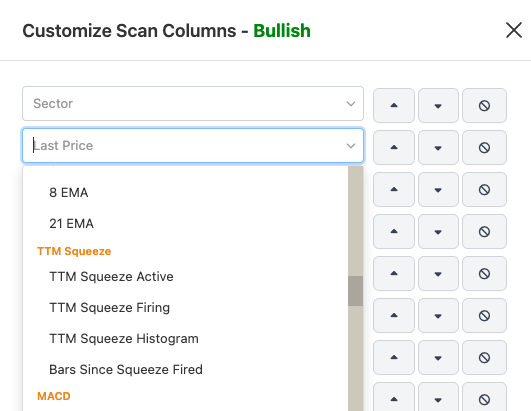
If you’re really into indicators, here’s the complete filter list as of July 7th 2026
New since April 2026
- Stochastic (14,3,3) — above/below value, overbought/oversold, above/below the signal line
- Compression Break — Long / Short — the daily compression break, generalized to any timeframe
- VWAP Bounce — Bullish / Bearish — the hard VWAP bounce, now directional
- “Near a level” filters — price within X% of VWAP, the 8/21/50 EMA, the 50/100/200 SMA, high/low of day, today’s open, or yesterday’s close/high/low
- Slope filters — numeric thresholds on VWAP slope, RS slope, LRSI slope, and Bollinger-Band-width slope
- Volume character — Volume rising/falling and Relative Volume rising/falling by timeframe
- Candle size increasing / decreasing
Fundamentals (20 filters)
- Price: Minimum price; Maximum price
- Market Cap & Float: Market Cap Min/Max; Float Size Min/Max; Float % Min/Max
- Options & Flow: Has Weekly Options; Call %; Put %
- Earnings & News: Earnings Recently; Earnings Soon; Has News Today
- Flagged: Flagged / Not Flagged — Green, Yellow, Red
- Sectors: 12 industry categories
Relative Strength and Volume (5 filters)
- Relative Strength: RS slope above/below value [MTF]
- Volume and Relative Volume: Volume rising [MTF]; Volume falling [MTF]; Relative Volume falling [MTF]
Trend & Momentum (8 filters)
- RSI & LRSI: LRSI slope above/below value [MTF]
- Stochastic: above/below value [MTF]; overbought (80+) [MTF]; oversold (20−) [MTF]; above/below signal line [MTF]
Moving Averages & Volatility (9 filters)
- EMA: Near 8 / 21 / 50 EMA (within %) [MTF]
- Daily SMAs: Near 50 / 100 / 200 SMA (within %)
- TTM Squeeze: TTM Squeeze fired recently [MTF]; BB width slope above/below value [MTF]
Price Levels (11 filters)
- Today: Near high of day / low of day / today’s open (within %)
- Yesterday: Near yesterday’s close / high / low (within %)
- VWAP: Near VWAP (within %); VWAP Bounce — Bullish / Bearish; VWAP slope above/below value [MTF]
Patterns (4 filters)
- Chart Patterns: Compression Break — Long / Short [MTF]
- Candle Patterns: Candle size increasing / decreasing [MTF]
Intraday Technicals (91 filters)
- Trend & Momentum: ZenTrend Bull/Bear Cycle [MTF]; Strong trend up/down (ADX) [MTF]; Trend Buying/Selling Signal (ADX + VWAP) [MTF]; RSI above/below value [MTF]; LRSI strong/weak trend, above/below value, slope up/down [MTF]; MACD above/below zero, recent cross up/down [MTF]; Bollinger Band width increasing [MTF]
- Relative Strength: RS/RW vs SPY [MTF]; RS/RW increasing [MTF]
- Volume and Relative Volume: Relative Volume (RVol); RRVol (vs SPY); Relative Volume rising [MTF]; High RVol yesterday; Minimum volume today; Minimum average volume; Volume fill
- EMA and EMA Cross: 3/8 and 8/21 EMA positioning and recent crosses [MTF]; EMA Power Angle — Bullish/Bearish [MTF]
- VWAP: Above/Below VWAP; Strong VWAP slope up/down
- Patterns: Bull/Bear Flag [MTF]; Consolidating [MTF]; Making new highs/lows [MTF]; VWAP hard rejection
- Heiken Ashi: Reversals and continuations (recent and “bars since”) [MTF]; HA Compression Break Bull/Bear [MTF]
- Big High-Volume Candles: Recent Bullish/Bearish Key Bar [MTF]
- TTM Squeeze: Squeeze on [MTF]; Squeeze firing [MTF]
- ATR: Minimum ATR $ [MTF]; Minimum ATR % [MTF]
- Price Change: % and $ increases/decreases, today and yesterday
- Price Levels Today: Above/below today’s open; above pre-market high / below pre-market low; near high/low of day
- Price Levels Yesterday: Above/below yesterday’s close, high, low, and range; above prior day high / below prior day low
- Big candles: Recent big candle — bullish / bearish
Daily Chart Technicals (52 filters)
- Trend & Momentum: Strong / Weak daily chart
- Relative Strength: RS and RW over 1 week, 2 weeks, 1 month, 2 months
- Simple Moving Averages: Above/Below 50, 100, 200 SMA; SMA 50>100>200 (and inverse); Near a major daily SMA; Between two daily SMAs
- AVWAP (Anchored VWAP): Above/Below the earnings, prior-earnings, quarter, yearly, and 52-week anchors
- Price Levels: Near high/low of year, monthly high/low, three-month high/low; new highs/lows within 10 or 20 days
- Gaps: Gap up/down from yesterday; recent gap up/down; in a gap; near a gap
- Patterns: Recent SMA break — Bullish / Bearish
- Big High-Volume Candles: Recent Bullish/Bearish Wick [MTF]
- ATR & ADR: Minimum ADR $; Minimum ADR %