Start here
Watch: the October 2026 walkthrough
ZenBot Scanner watches more than 6,600 US stocks and puts tickers with the same setup into scans. A scan might be “strong against the market on heavy volume” or “gapped up on news and still being bought”. Pick one, look through the charts, and flag the names worth another look.
The scans look for signs of real buying or selling: strength against SPY, relative volume, options positioning, and price structure on several timeframes. Use a built-in scan, narrow it with filters, or build your own.
New here? Read Getting Started, then Interface Tour. Used ZenBot before? Start with what’s new, below.
New in October 2026
- Scan results as charts: flip any scan to Cards and every ticker becomes a chart.
- Fast Charts: there the moment you click, and now you can scroll, zoom and type over them.
- Trade Signals: Buy and Short ideas on the chart, and scans of who just got one.
- Super Search: press / for tickers, scans, filters and settings in one box.
- Saved filters: set a filter up once, name it, use it on any scan.
- Scan Explainer: see which condition is emptying your scan.
- Right-click menus on every ticker, chart and scan.
- Chart windows with up to eight charts, linked and saved.
- Alerts with a chart on Telegram and Discord.
Inside the app
The Learn menu has this guide and more.In the top bar, Learn opens Trading Strategies (which scans suit which style of trading), this guide and its videos, the Scan Playground, What’s New, and the ZenBot Discord.
Learn to trade
ZenBot finds charts to look at. You’ll still need a trading plan. The scanner is built on ideas I learned from Hari at RealDayTrading and Pete at OneOption: relative strength, relative volume, and finding the stocks the big money is trading. Both are great places to learn:
- r/RealDayTrading: a free wiki built around relative strength. Which ZenBot scans fit it: Real Day Trading with ZenBot.
- OneOption: a structured trading program with a daily room. Which ZenBot scans fit it: OneOption with ZenBot.
Trade a different way? The Trading Strategies page covers eight well-known styles, from momentum breakouts and small-cap gappers to growth leaders, anchored VWAP and gap fades, and the scans and filters that fit each one.
Getting started
You can use ZenBot three ways. They share one account, so your flags, custom scans and settings follow you.
| Where | Best for | How to open it |
|---|---|---|
| Web app | Any browser, any computer | zenscans.com |
| Windows app | Sending tickers to your own charting program | The Microsoft Store, or Settings (gear) → Install Windows App |
| Phone | Checking scans away from your desk | Open zenscans.com in your phone’s browser |
You don’t need an account to look around. Sign in (top right) to keep your flags, scans and layouts, and to get alerts on your phone.
Your first scan
- Open ZenBot and click In Play in the scan list on the left: the stocks gapping on news with real volume.
- Click a row. The charts on the right switch to that ticker.
- Press ↓ to step down the list. Each press loads the next chart.
- When you see a setup you like, press 1 to flag it green.
- Try another scan from the list on the left, such as Top Longs.
- Later, open Your Green Flags at the top of the list to see everything you flagged.
That’s the basic loop: pick a scan, look through the charts, flag the ones you like. The rest of the app helps you do it faster or narrow the list. Not sure where to start? I’d begin with In Play and Top Longs. Or find your style on the Trading Strategies page and start with its scans.
Not sure which scans fit you?
Open Scan Playground at the top of the scan list and take the 30-second quiz. It suggests scans for the way you trade. See Scan Playground.Around the screen
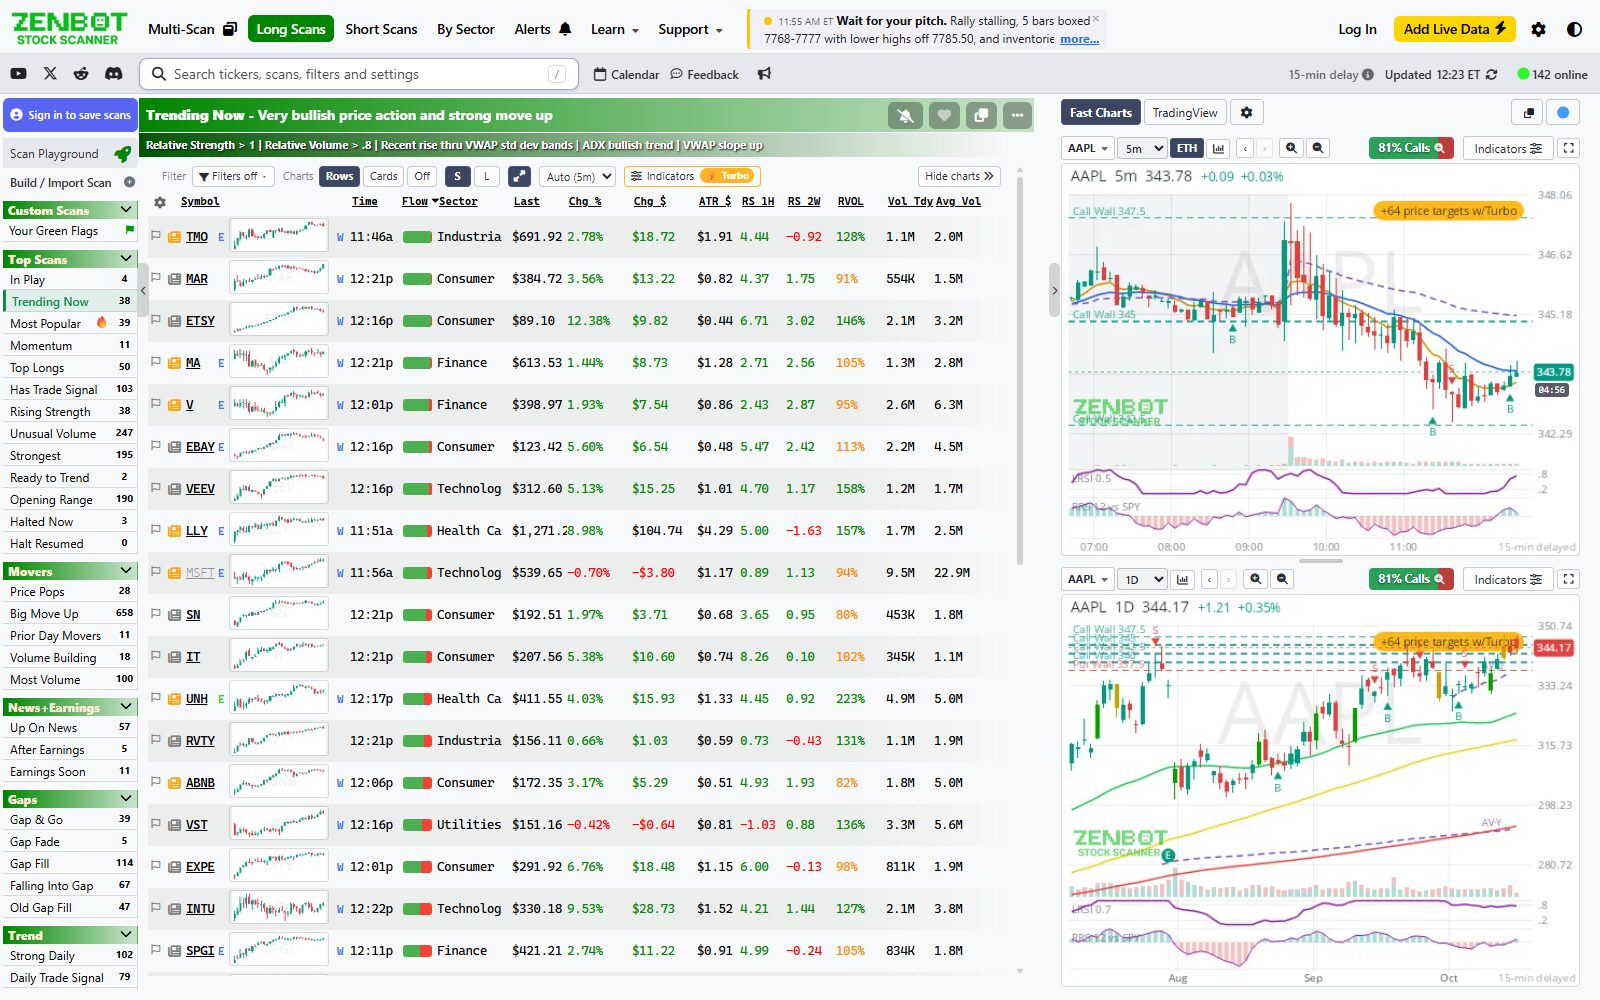
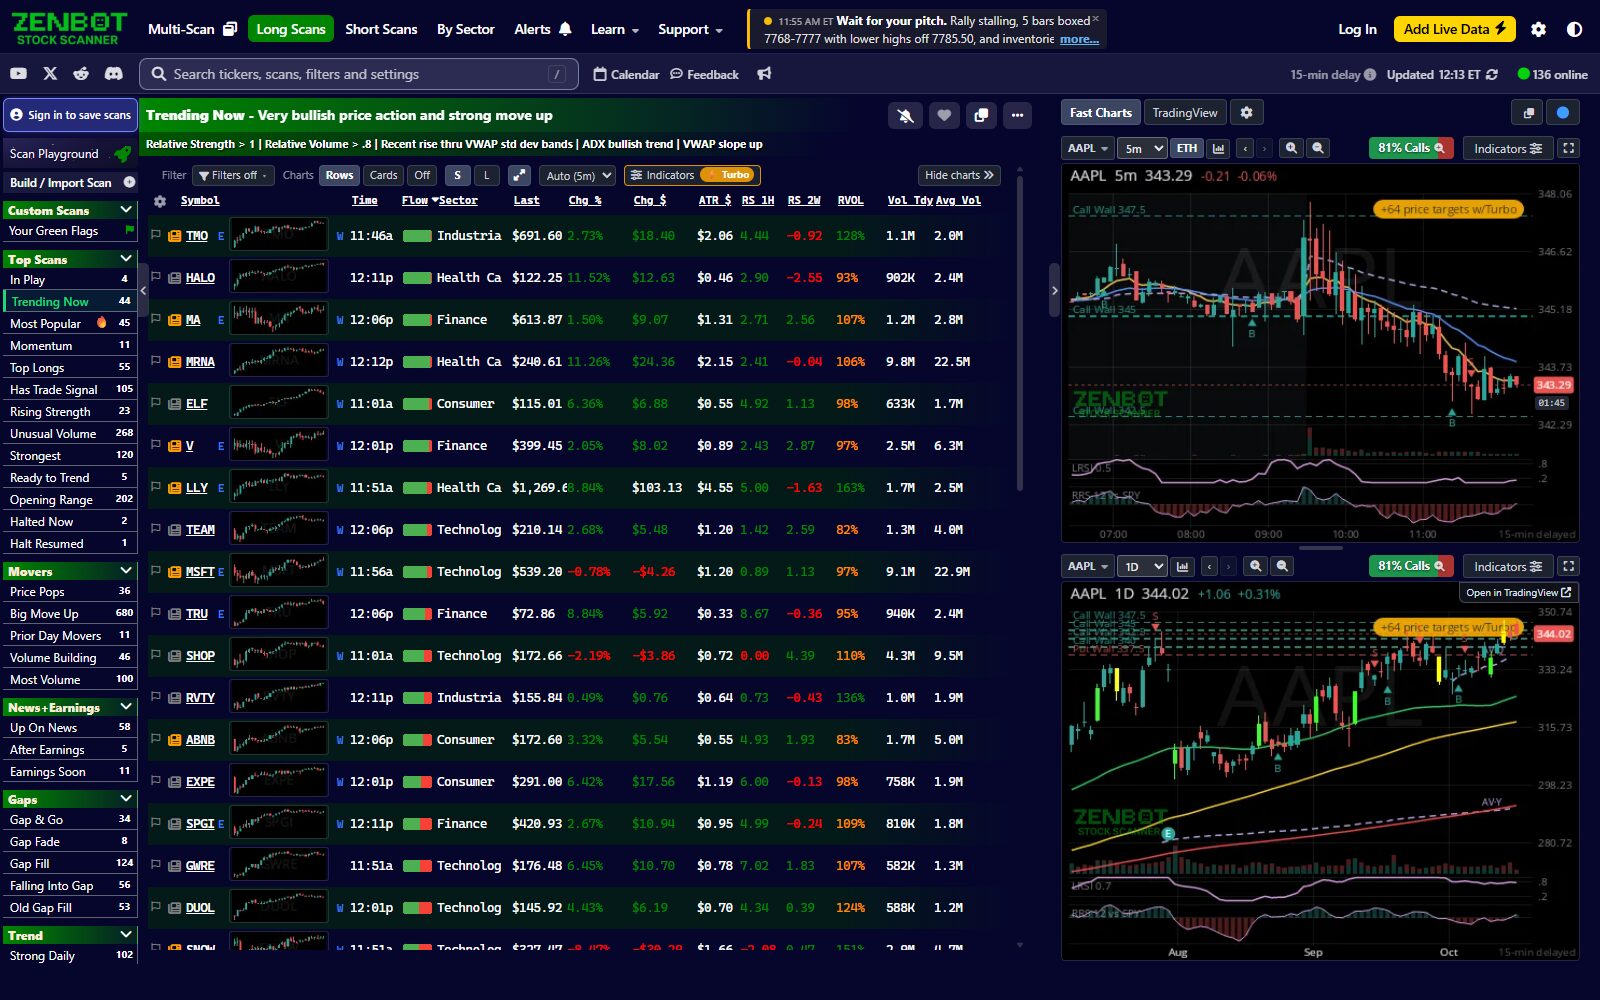
The screen has five parts.
Top bar
Multi-Scan, Long Scans, Short Scans, By Sector, Alerts, Learn and Support on the left. Your account, the settings gear and the light/dark switch on the right. The box in the middle is the latest market commentary.
Search bar
The gray bar under it. Search tickers, scans and filters. On the right it shows when the data last updated.
Scan list (left)
Scan Playground, Build / Import Scan, your custom scans, then the built-in scans in groups: Top Scans, Movers, News+Earnings, Gaps, Trend, Pullbacks+Levels, Options.
Results (middle)
The tickers on the scan you picked. Rows by default, with a small chart in each row. Switch to Cards to see the scan as a wall of charts.
Charts (right)
Two charts for the selected ticker, intraday on top and daily below. Choose Fast Charts or TradingView with the tabs above them. Hide charts gives the results the whole width.
Top bar menus
Hover a menu to open it, or click it.
| Menu | What’s in it |
|---|---|
| Long Scans / Short Scans | Every scan on that side, laid out in columns by group. Clicking the tab itself switches the list on the left to that side. |
| By Sector | The eleven sector scans and the sector strength view. |
| Alerts | Recent Alerts, Edit Alerts, Alert Settings, Market Commentary. A dot on the bell means alerts have fired. |
| Learn | Trading Strategies, User Guide & Videos, Find scans for my style, What’s New, ZenBot Discord. |
| Support | Contact Support, Make a Suggestion, Report a Problem. |
| My Account | Manage Account, Log Out. |
| Gear | Chart Settings, Multi-Scan Layout, Alert Settings, light/dark mode, Install Windows App. |
Notices
A bar across the very top warns you about something like a data delay. A card at the bottom announces a feature; its button opens the details, and the × dismisses it for good.
Free vs. Turbo
The free plan gives you the scanner on a 15-minute delay. Turbo gives you live data, larger chart views and higher limits.
Free · $0
- Every day-trade and swing-trade scan
- Unlimited custom scans
- Charts, news and market commentary (charts for 150 different tickers a day)
- Scan alerts in the app, on Telegram and on Discord, with 25 alert charts a day
- Chart previews in each scan row
- Multi-scan layout: up to 6 scans in 3 columns
- Windows app: launch tickers in your own charting program
Turbo · $25/month or $250/year
- Real-time data in scans, charts, news and commentary
- Real-time alerts, with a chart in the app, on your desktop, on Telegram and on Discord. With Charts in alerts on, every Telegram and Discord alert carries live charts, no daily limit
- Real-time charts across the results grid, and a live chart when you hover a symbol
- Your own indicators on the grid and row charts
- Up to 20 saved filters (free keeps three)
- No daily chart limit
- Full target levels from options open interest
- Bigger dashboards: more than 6 scans, 4–6 columns, unlimited pop-out windows
- Copy and export scan results to CSV or your clipboard
Turbo costs $25 a month or $250 a year. The yearly price saves two months. You can switch from monthly to yearly any time in My Account.
New accounts can try Turbo free. Open Add Live Data in the top bar, or My Account → Manage Account, to see the two plans side by side and start a trial. That page also has answers to the common billing questions. See Your Account.
On the free plan a 15-minute delay note sits in the gray bar. It applies to scans, charts and alerts alike.