Fast Charts
I love the TradingView charts, and they aren’t going anywhere. But when you’re working through a scan you aren’t studying one chart. You’re flipping through thirty of them, and every second of loading adds up. Fast Charts are built for that job.
The big one: they show what Zen knows. Because the engine is ours, I can draw Zen’s own data the way it should look: the option call and put walls right on the price chart, Relative Strength against SPY, ZenTrend, and the Trade Signals markers on the bar where they fired. The same engine draws the chart previews on your scans and the chart that lands on your phone with an alert, so what you see in one place is what you see everywhere. And they’re easy on your computer: open six chart windows across two monitors and nothing slows down.
The right panel shows two charts for the selected ticker: intraday on top, daily below. Use the tabs above them to choose the chart style.
| Tab | What you get |
|---|---|
| Fast Charts | Charts drawn by ZenBot. They appear at once as you move down a list, and carry ZenBot’s own overlays: trade signals, option levels, ZenTrend, split markers. |
| TradingView | The full interactive TradingView chart, with its own indicator library and drawing tools. Slower to switch tickers. |
I use Fast Charts to go through the scan and TradingView for the two or three names I actually want to trade. Open in TradingView switches the current ticker. Set which chart opens by default with Default chart style in Chart Settings (the gear above the charts).
Move around a Fast Chart
- Scroll back: drag the chart or hold Shift while turning the mouse wheel.
- Zoom: the mouse wheel, or the + and − buttons.
- Now on the time axis brings you back to the latest bar after scrolling back.
- Countdown: on a live intraday chart, the price axis counts down to the bar’s close.
- Timeframes from 1 minute to weekly.
- Earnings: an E marks the bar where the company reported, green for a beat, red for a miss, on daily, 4-hour and weekly charts.
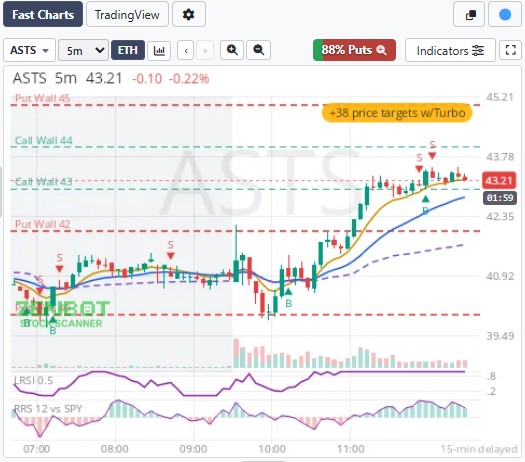
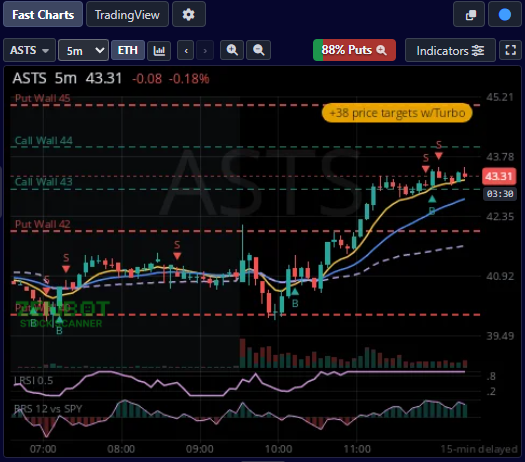
Above each Fast Chart
| Control | What it does |
|---|---|
| The ticker | Click it to look up and load another ticker. |
| 1m 5m 15m 1h 4h 1D 1W | The chart’s timeframe. |
| ETH | Shows or hides premarket and after-hours bars on intraday charts. |
| Candle style | Candles, Heikin-Ashi or Line. |
| ‹ › | Step back and forward in time. Hold Shift to move a full screen. You can also drag the chart. Now returns to the latest bar. |
| Zoom + / − | Fewer or more bars on screen. |
| Calls / Puts % | The balance of options positioning. Click for the options detail. See Options Flow. |
| Indicators | Switch ZenBot’s overlays on and off, set the size of the lower panes, and open All indicators. |
Typing a timeframe
Put the pointer over a Fast Chart and type 5m, 15m, 1h, 4h, 1D or 1W, then Enter. Only that chart changes. You can give the top and bottom charts different timeframes.
Chart indicators
Two I use every day: Relative Strength compares the stock with SPY in its own pane. Is it stronger than the market, or just riding it? Anchored VWAP starts from Earnings, Prior Earn, Quarter, Jan 1 or 52W in one click. Volume bars split estimated buying (green) and selling (red). That’s worked out from each candle’s shape, not exchange data, but it helps big climax bars stand out.
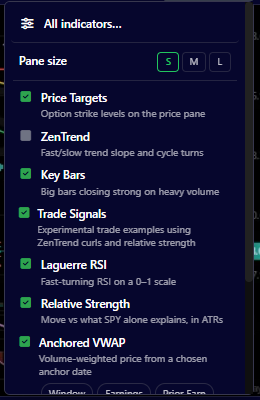
Indicators → All indicators opens the full list. Search for one by name and add it.
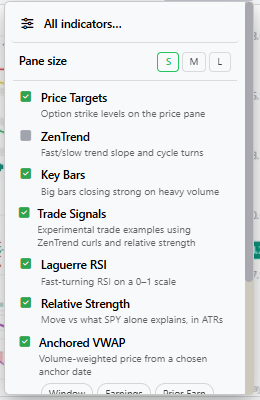
- On the price chart: moving averages (SMA or EMA, any length, as many as you want), session VWAP, anchored VWAP (from earnings, prior earnings, the quarter, 1 January or the 52-week high or low), key highs and lows, prior day high / low / close, pivot points, Bollinger, Keltner, ATR bands, SuperTrend, Ichimoku, Parabolic SAR, Volume Profile, buy / sell volume.
- In their own pane: RSI, Stochastic, MACD, ADX / DMI, OBV, TTM Squeeze.
- ZenBot’s own: Trade Signals, ZenTrend, option target levels and others, listed in the Indicators menu.
Want to start over? Defaults puts everything back as it was.
Stock splits
Fast Charts adjust past prices for stock splits, so a 10-for-1 split doesn’t appear as a 90% drop. A small S marks the day of the split; hover it for the ratio. Scans ignore a stock on the day of its split and the day after, when its numbers are not comparable.
Live vs. delayed
On Turbo, charts update live. On the free plan they are 15 minutes behind and say so in the corner. The free plan also opens charts for up to 150 different tickers a day; after that, charts you already opened that day still work. The count starts again at midnight Eastern.
Pop-Out Windows
If you run a few monitors, pop a scan into one window and its charts into another. Any scan or chart can have its own window.
- Pop out a scan: the two-squares button on the scan heading, or right-click a scan and choose Open in new window.
- Pop out a chart: the two-squares button above the charts, or right-click a ticker and choose Open chart in new window. The new window follows whatever ticker you click.
Linking windows by color
Each window has a colored dot. Click it, and under Link this window choose a color: Blue, Purple, Teal, Green, Yellow, Orange or Red. Windows that share a color follow each other: click a ticker in one and the others load it. Choose Not linked for a window that should keep its own ticker.
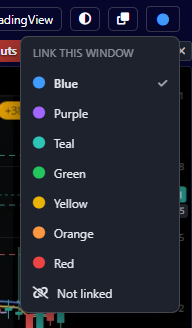
Use blue for a long scan and its chart, red for a short scan and its chart. The two sets follow their own tickers.
The free plan allows three pop-out windows open at a time, scan windows and chart windows together. Turbo has no limit.
Chart Windows
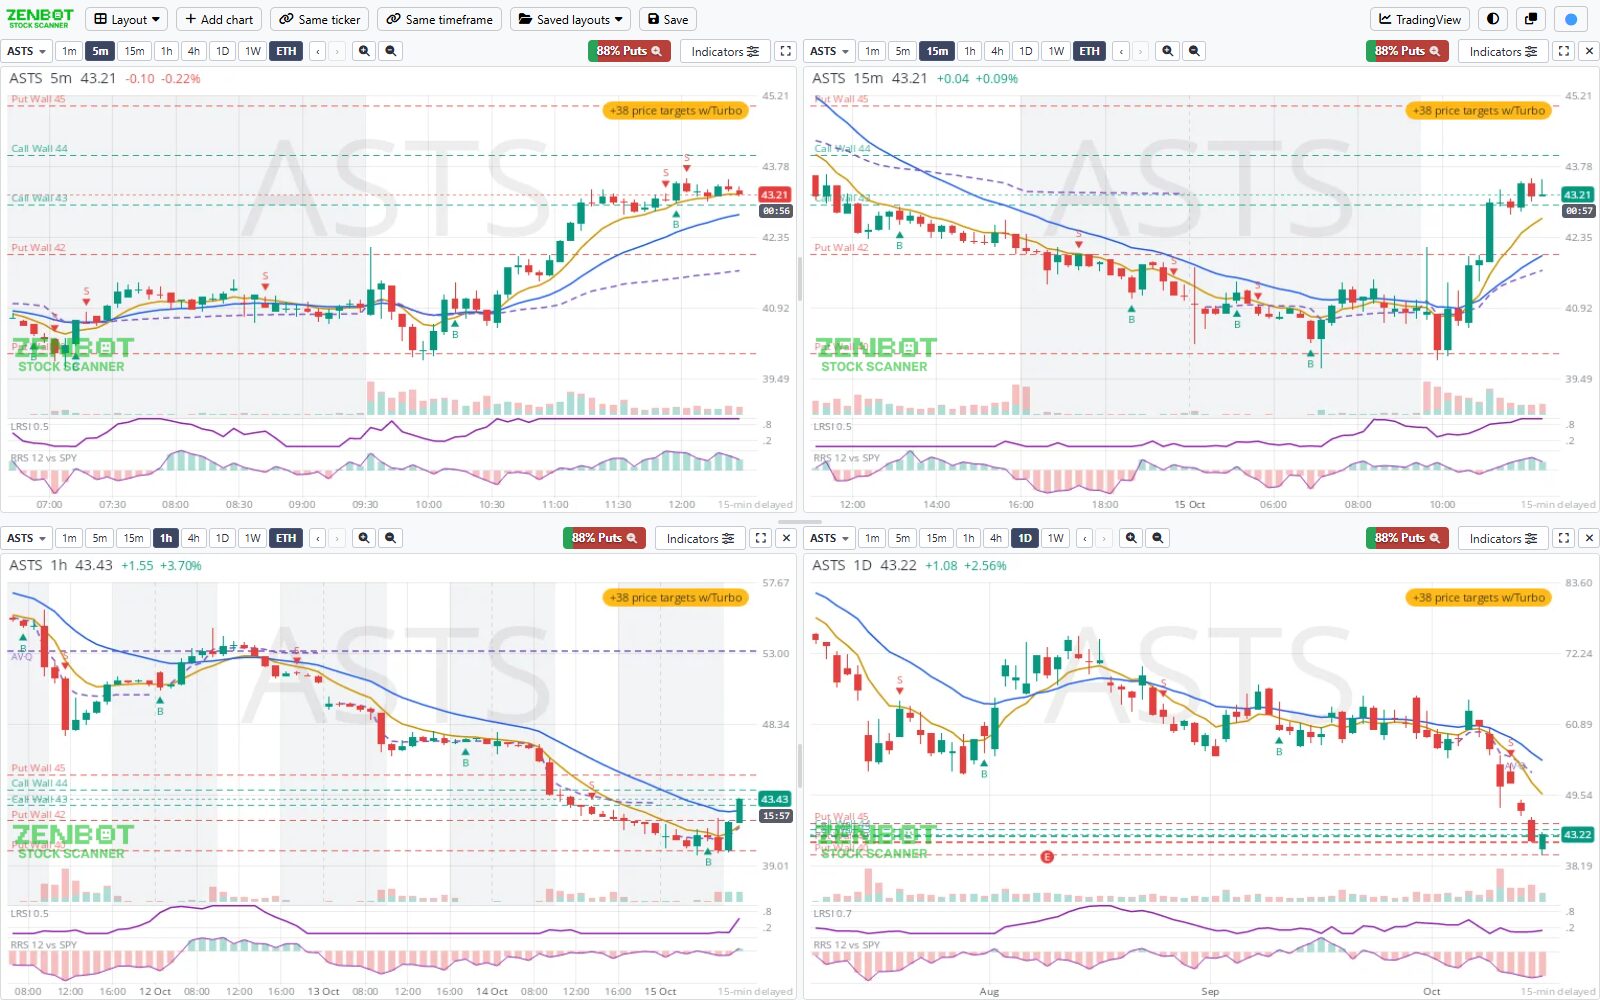
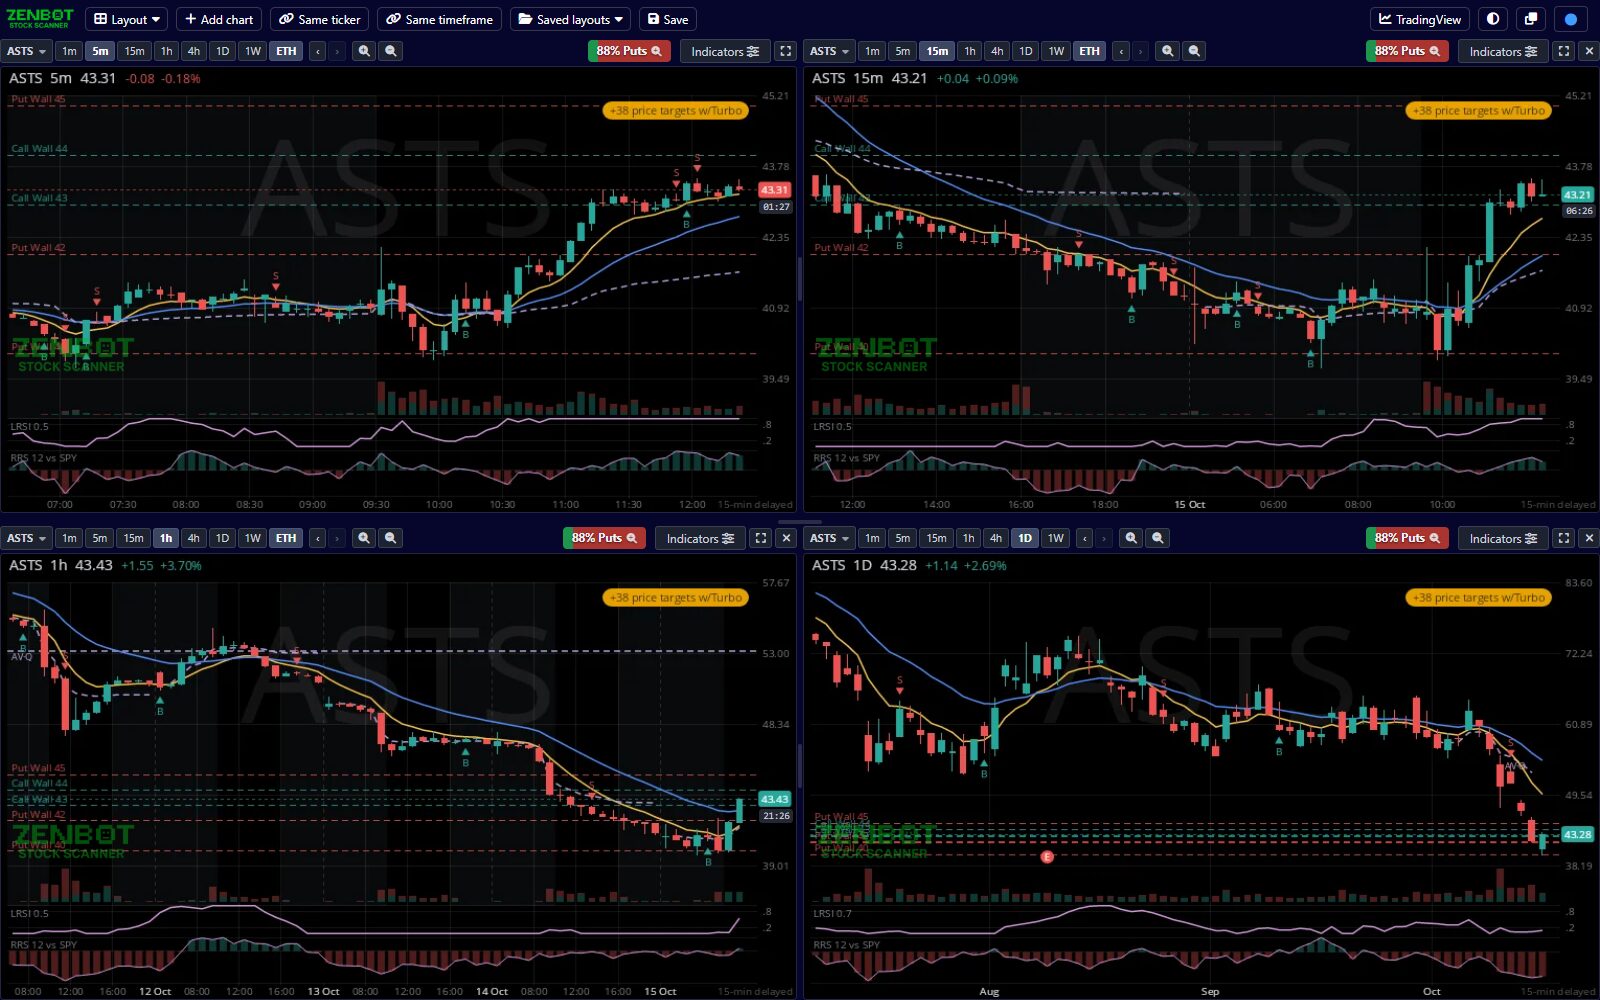
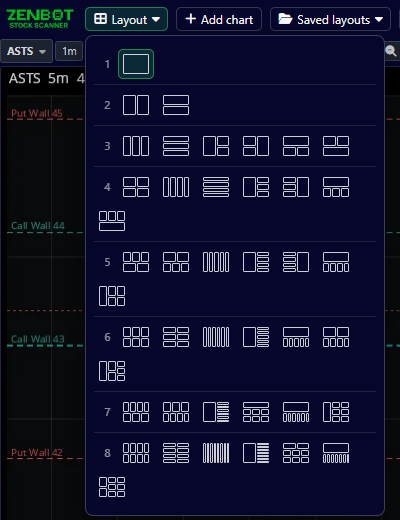
Put up to eight charts in one window, each with its own ticker and timeframe. All eight are available on every plan.
| On the window’s bar | What it does |
|---|---|
| Layout ▾ | How many charts, from one to eight, and how they’re arranged: side by side, stacked, a grid and more. |
| Add chart | One more chart, up to eight. |
| Same ticker | Every chart shows one stock, for example one stock on four timeframes. Turning it on brings every chart to the one you were last on. |
| Same timeframe | The reverse: every chart on one timeframe, for example four stocks on the 5-minute. |
| Saved layouts ▾ and Save | Name the window’s setup and keep it. See below. |
| TradingView / Fast Charts | Flips every chart in the window to interactive TradingView charts, same layout, so you can zoom, scroll back and draw. Fast Charts flips back. |
- Resize: drag the line between two charts. Double-click it to even them out.
- Crosshair: move across one chart and the crosshair follows on all of them, so you can line up the same moment on the 5-minute and the hourly. The date and prices show on the chart under your pointer.
- Small charts stay tidy: when a chart gets narrow its bar drops the extras and keeps the ticker, timeframe and Indicators.
Saved layouts
Set up the window, open Saved layouts, name it something like “Morning wall”, and click Save. Changes save as you go, and the name appears on the window’s bar. You can keep up to 20 layouts in your account and use them on any computer you sign in on. The trash icon removes one.
The first chart window you open comes back the way you left it, with the ticker you opened it for.
Technical indicators
Here’s what the readings mean when you see them on a chart or in a filter.
Relative strength vs SPY
How the stock has done against the market over a window. A stock that is up 1% while SPY is down 0.5% is strong. Strength that holds when the market dips is one of the better signs of real buying.
Relative volume (RVOL)
Today’s volume against what is normal for this time of day. Above 2 means unusual interest. The “High RVOL in the last N bars” filters look for a single bar that traded several times its recent average, on whichever timeframe you choose.
Laguerre RSI (LRSI)
A smoother, faster cousin of RSI, on a scale of 0 to 1.
| Above 0.80 | Stretched. |
| Below 0.20 | Washed out. |
| Rising | Momentum building. |
Stochastic and Slow Stochastic
The standard Stochastic filters, plus a Slow Stochastic with 34 / 10 / 3 settings and an exponential signal line: above or below a value, and above or below its own signal.
Bollinger bands
Filters for the band width (a squeeze), and for price closing above the upper band or below the lower band on any timeframe.
VWAP
The volume-weighted average price for the day. Above it, buyers have had the better of the session; below it, sellers. The anchored VWAP filters do the same from a chosen starting point, such as the last earnings report.
Moving averages
The 50, 100 and 200 SMA and the 8, 21 and 50 EMA, on any timeframe. See Filters for near, above, below, bounced and rejected.
ADX and ATR
ADX measures trend strength in either direction. Under 20 usually means chop; over 40, a strong trend. ATR is the average size of a bar, handy when you think about stops and position size.
Heikin-Ashi
Heikin-Ashi candles average price to smooth out noise. Scans such as Turning Up use the flip from red to green on the 15-minute chart. You can also view any Fast Chart in Heikin-Ashi from the candle style menu.
Agreement beats any one reading
- Strong against SPY
- Volume above normal
- Above VWAP
- A fresh trade signal or a ZenTrend cycle start
- Options positioning on the same side