Reading scan results
Every scan uses the same results table. Click a column heading to sort; click it again to reverse the order.
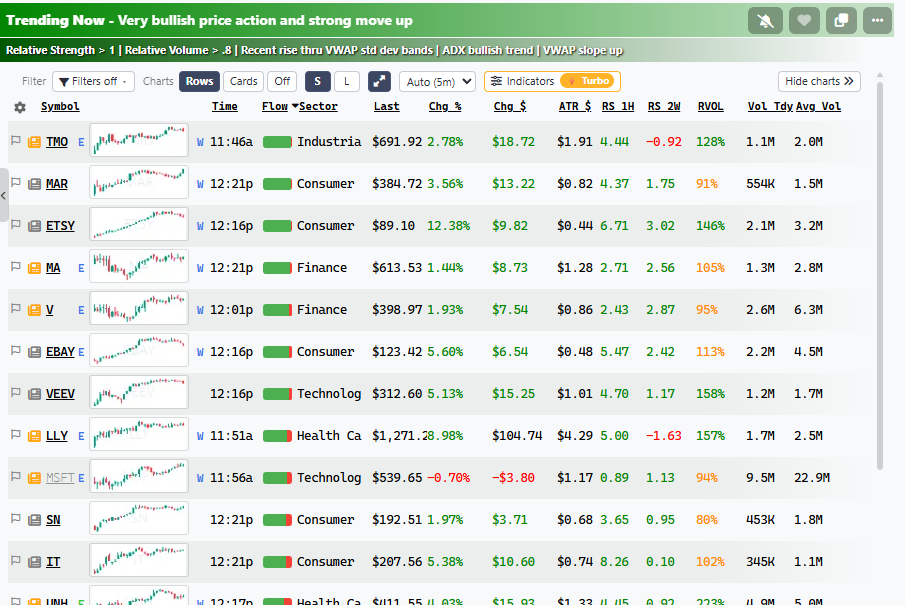
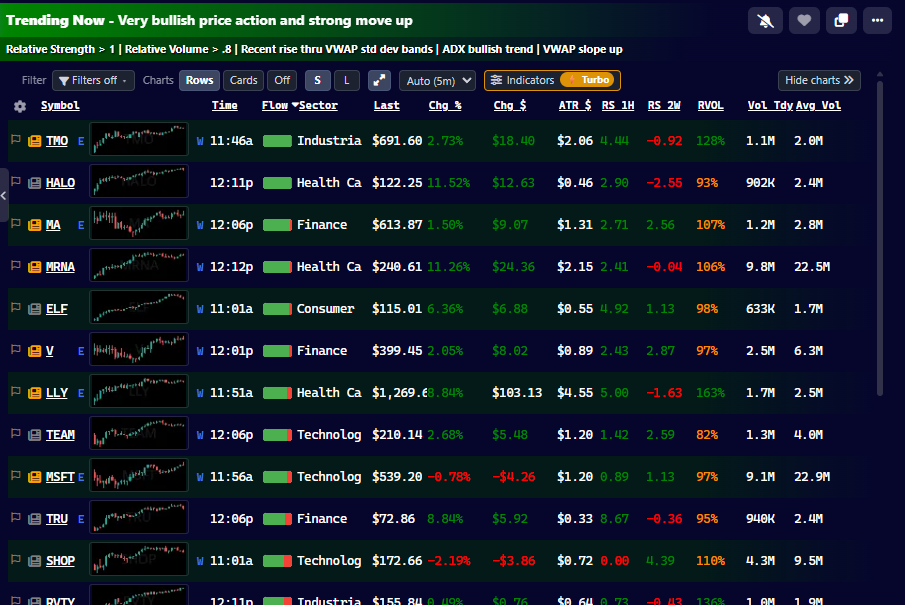
Above the results
| Control | What it does |
|---|---|
| Filter (Filters off ▾) | Opens your saved filters, or the filter dialog. See Filters. |
| Charts: Rows / Cards / Off | A small chart in each row, the scan as a wall of chart cards, or no previews. See Chart Previews. |
| S / L | Small or large preview charts. |
| Hide charts » | Hides the chart panel on the right so the results get the whole width. Show charts « brings it back. |
| Timeframe | The timeframe of the preview charts. Auto picks one that suits the scan. |
| Indicators | Choose what the preview charts draw (Turbo). |
| 59 of 6,665 · Explain | How many tickers passed, out of how many. Click it to see why. See Explain. |
Symbol & basics
| Column | Meaning |
|---|---|
| Flag | Click to flag the ticker. See Flagging. |
| News icon | The ticker has news. Brighter means news today. Click for the story list. |
| Symbol | Click to load the charts. Hover for a summary and a small chart. |
| Age | How long the ticker has been on this scan. Small numbers are fresh arrivals. |
| Time | The clock time the ticker joined the scan, in Eastern time. On by default; turn it off in the column settings. |
| Flow | A bar showing the balance of call and put positioning. Click it for the options detail. |
| W / E | W: the stock has weekly options. E: earnings are near; hover for the date. |
| Last, Chg %, Chg $ | Price and today’s change. |
Relative strength
The RS columns compare a stock with SPY over different periods. Above zero means it beat SPY; below zero means it lagged. The farther from zero, the stronger the reading.
| Intraday | Daily |
|---|---|
| RS 1H, RS 2H and other intraday windows | RS 1W, RS 2W and longer |
Volume
| Column | Meaning |
|---|---|
| Vol Tdy | Shares traded today. |
| Avg Vol | Average daily volume. |
| RVOL | Today’s volume against the usual volume at this time of day. 1.0 is normal; 2.0 is double. A thin stock can show huge RVOL on little actual volume, so check Avg Vol too. |
Customizing columns
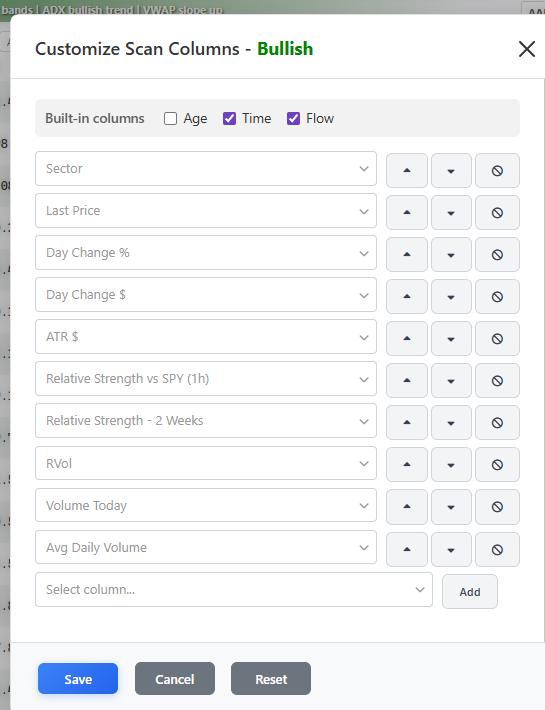
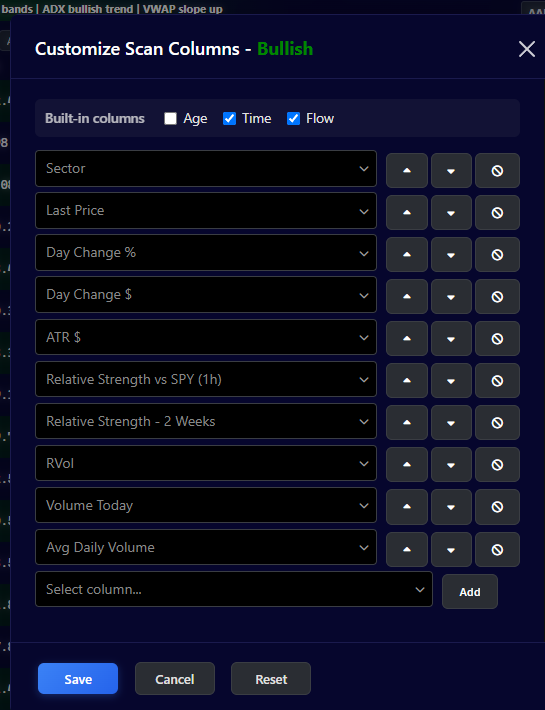
Click the gear at the left end of the column headings. In the dialog you can:
- Switch the built-in Age, Time and Flow columns on or off.
- Add a column, remove one, and move columns up or down.
- Reset to the defaults.
Long scans, short scans, sector scans and Multi-Scan each keep their own set of columns.
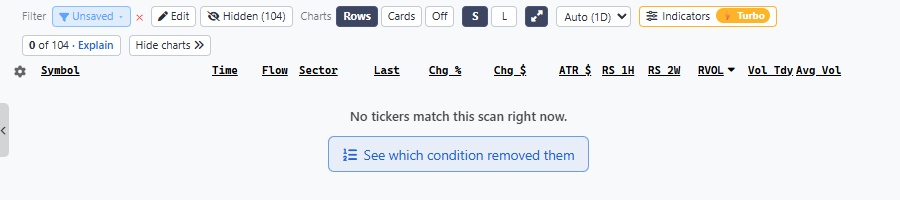
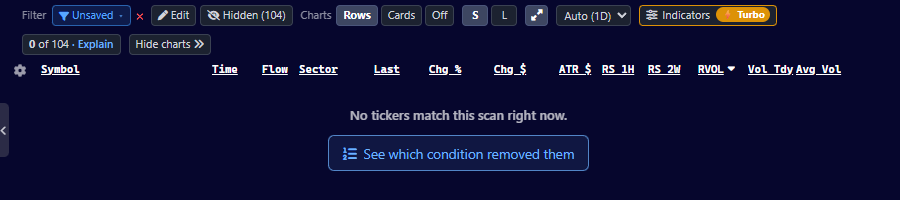
When a scan is empty
A scan with no rows says so and tells you why if a filter is hiding results. Click Explain to see which condition removed the tickers.
Scan results as charts
Watch: scan results as charts (3:04)
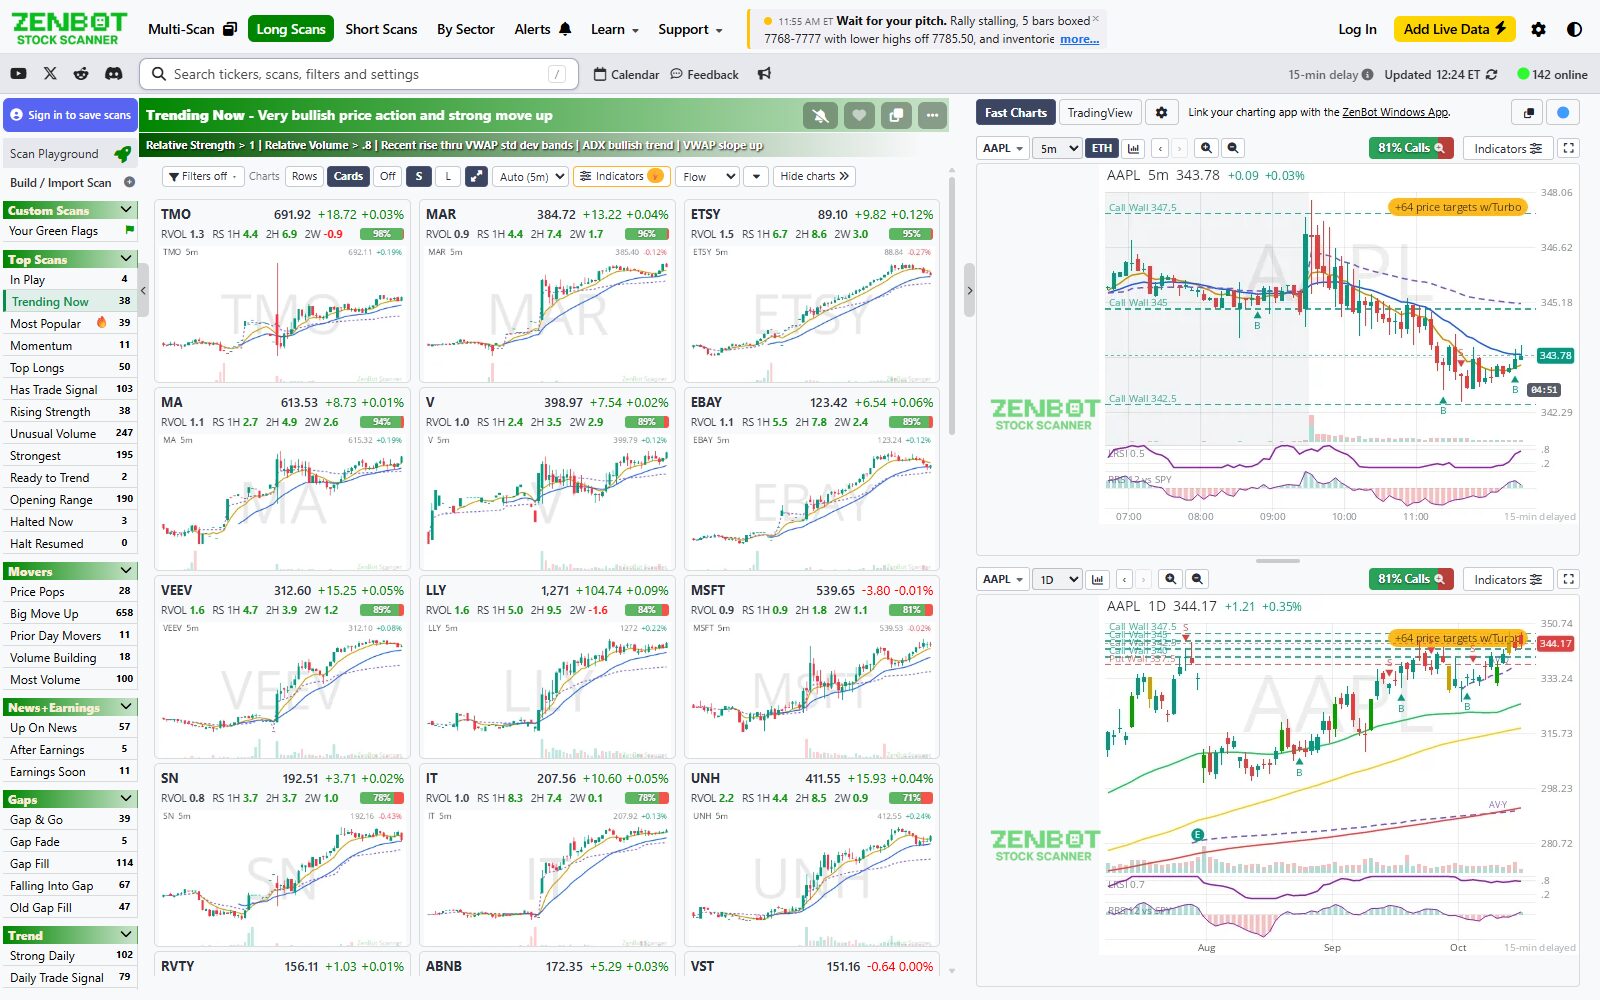
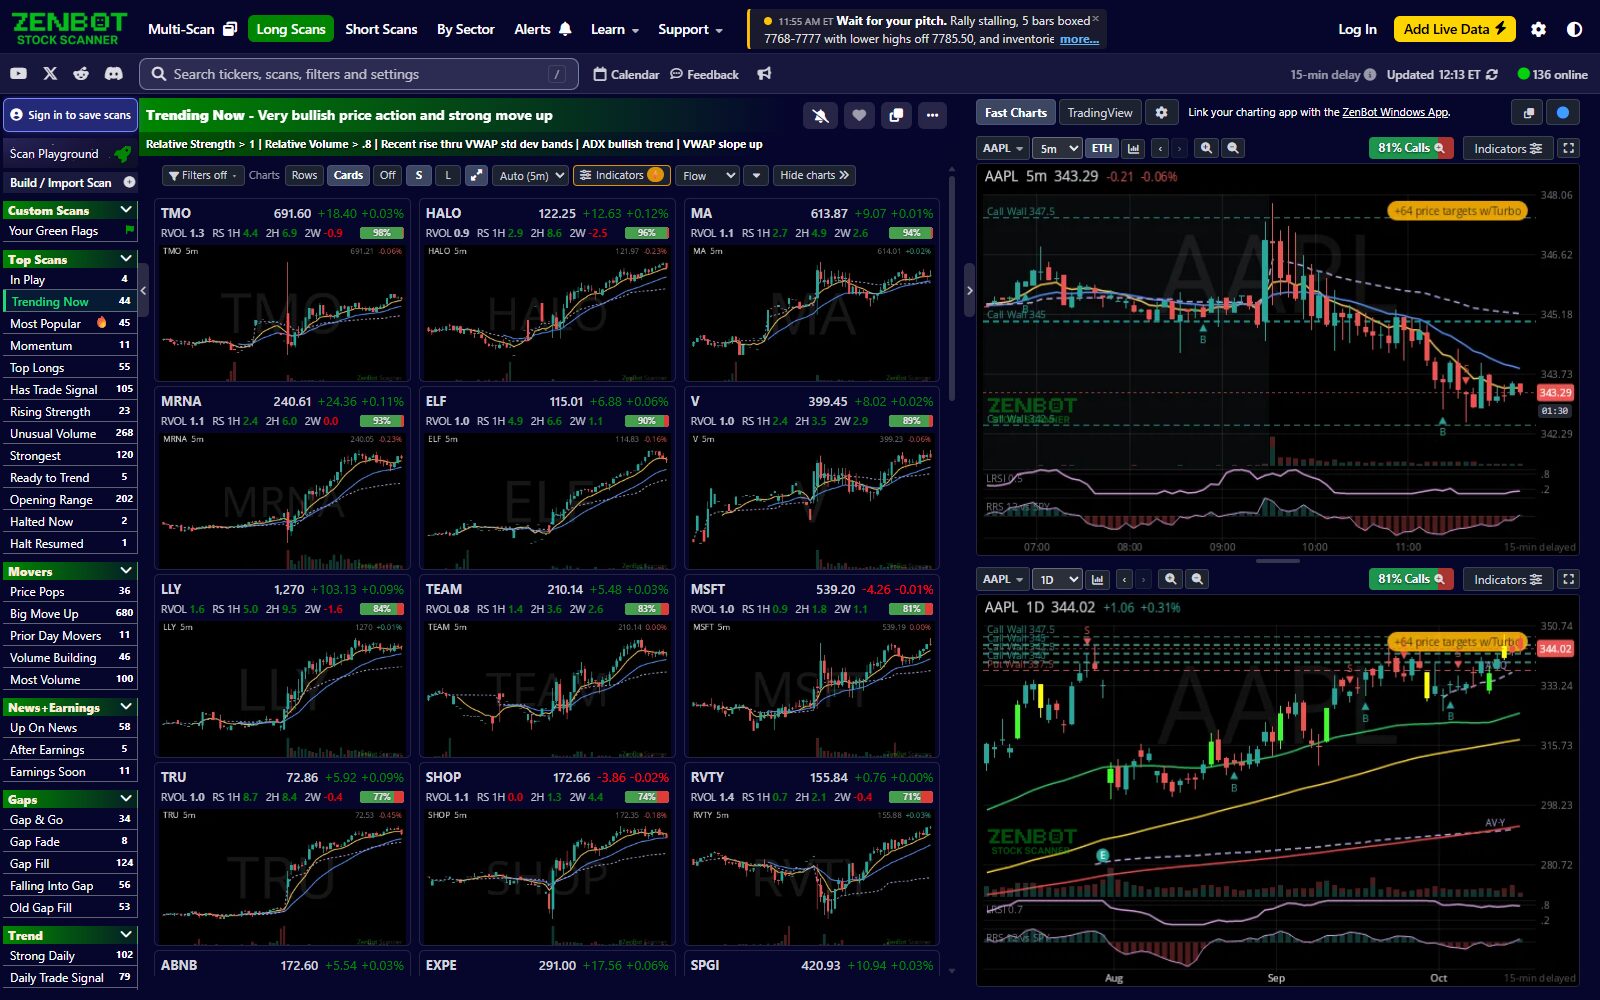
Switch to Cards and every ticker becomes a chart. Pick Rows for a small chart beside each name. Forty results used to mean forty clicks. Now it’s one scroll, and your eye does the sorting. That one’s extended. That one’s a mess. That one is sitting right on its moving average, and that’s the one I want. Use Charts: Rows / Cards / Off above the results.
| Mode | What you see |
|---|---|
| Rows | The normal table, with a small chart in each row. |
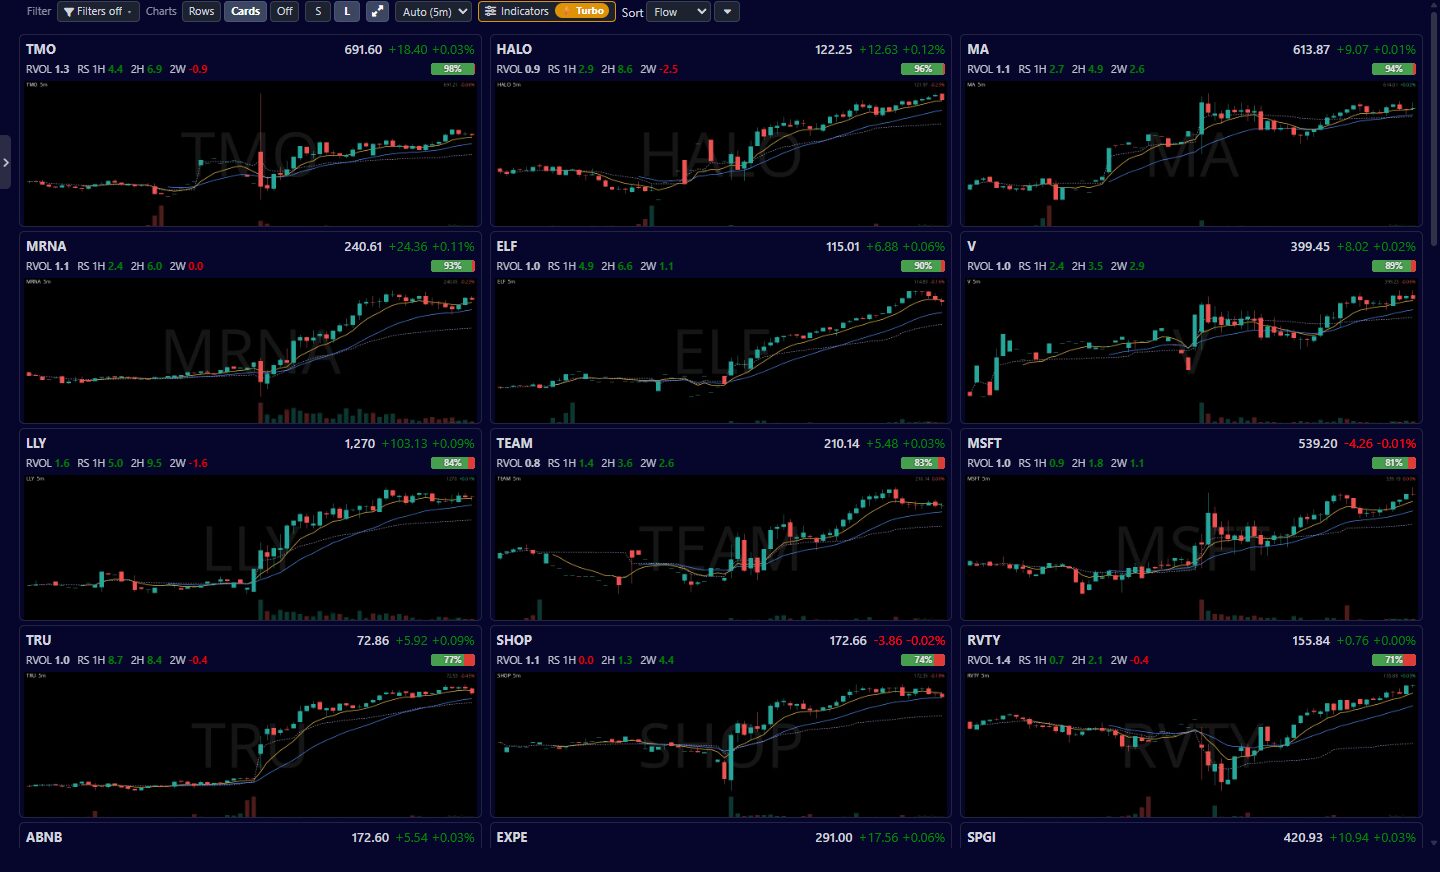
| Cards | The scan as a wall of chart cards. Each card shows the ticker, its price and change, and a few key numbers. A Sort control appears in the bar, since cards have no column headings. |
| Off | No previews. The plain table. |
- S / L sets the preview size, small or large, on every plan.
- The timeframe box changes every chart on the wall. Auto uses the scan’s timeframe, so a daily scan shows daily charts. Its choice appears in brackets.
- Indicators (Turbo) chooses what the previews draw, separately from the main charts.
- Pop out on hover: the button beside S / L. With it on, rest the pointer on a preview for a moment and a larger chart pops out. Rows open it to the side; cards grow in place.
Click a card or a row to load that ticker in the main charts. In Cards, the arrow keys move through the wall: ← → one card, ↑ ↓ a whole row, and the selected card scrolls into view.
A full-screen wall
I hide the scan list with the handle on its edge, hide the right charts with Hide charts », and pick L. The large cards fill the screen.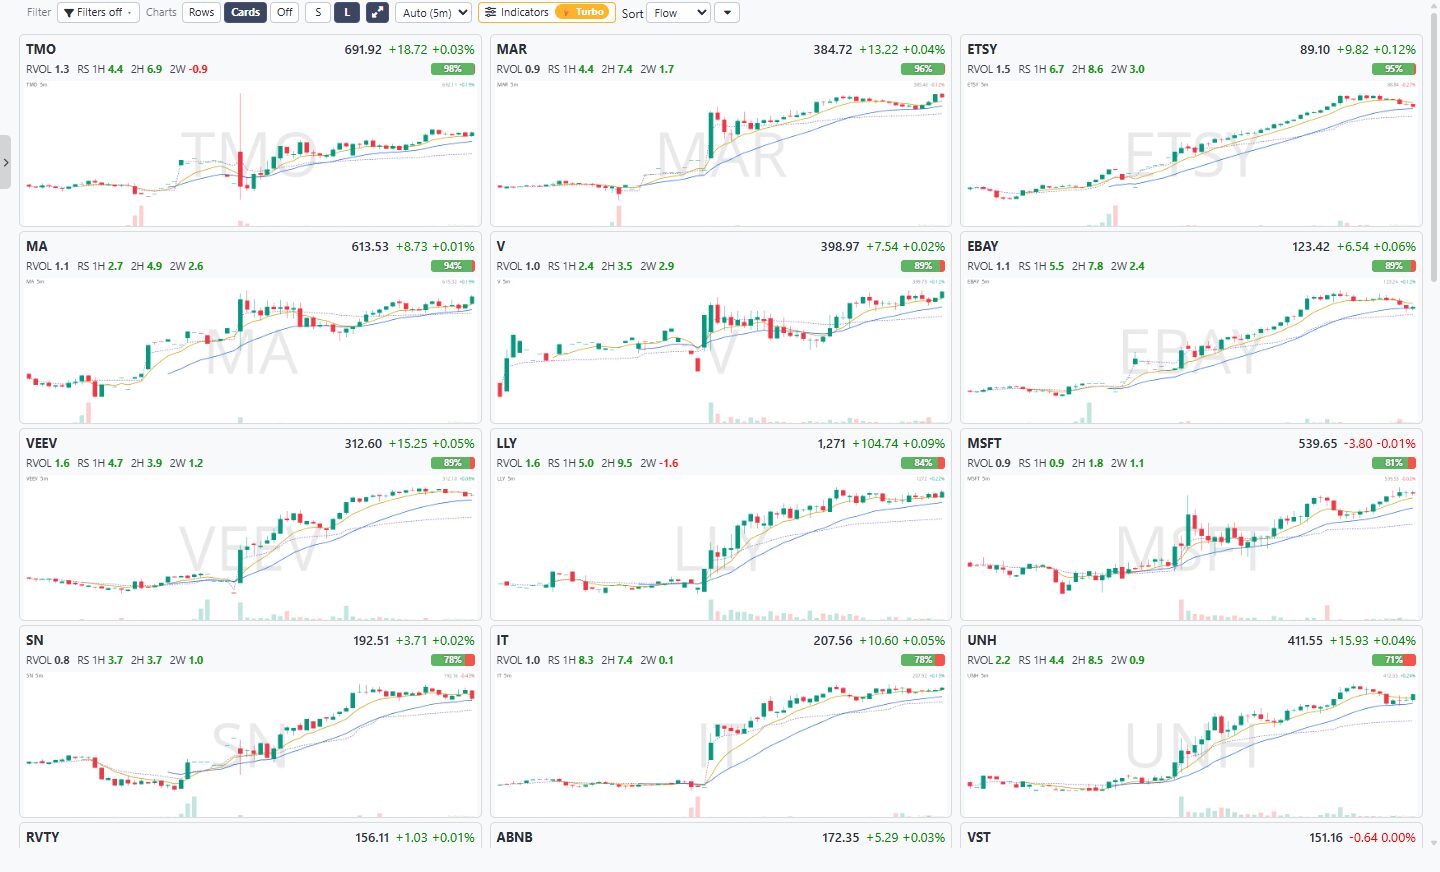
Hiding the charts
Hide charts », in the scan’s chart bar, the filter strip and the Multi-Scan heading, hides the chart panel on the right so the results get the whole width. Show charts « brings it back, or use the tab on the dividing line. Each computer and browser remembers its own choice, so hiding the charts on a laptop leaves them showing on your desktop.
Stock scans reference
Here are the built-in scans in list order. You can narrow any of them with filters.
Long scans
Top Scans
| Scan | Finds |
|---|---|
| In Play | Gapping on news with real volume, any size. The names everyone is trading today. |
| Trending Now | Very bullish price action and a strong move up. |
| Most Popular | Tickers viewed most often by other traders. |
| Momentum | Low-float momentum. |
| Top Longs | Strong vs SPY and trending up on rising VWAP. |
| Has Trade Signal | A chart Buy signal fired within the last 5 bars on the 5m, 10m, 15m, 30m or 1h chart. See Trade Signals. |
| Rising Strength | Relative strength is climbing. |
| Unusual Volume | Longs with the highest volume relative to their history. |
| Strongest | Highest relative strength over the past hour. |
| Ready to Trend | A ZenTrend bull cycle is starting. See ZenTrend. |
| Opening Range | Still above the high of the first 5 minutes, with relative volume of 1.25 or more, average volume of 1M or more, price above $5. |
| Halted Now | Trading is halted right now, from the official Nasdaq halt feed. |
| Halt Resumed | Resumed trading within the last 15 minutes. |
Movers
| Scan | Finds |
|---|---|
| Price Pops | Bullish price pops. See Price Pops. |
| Big Move Up | Large moves up today. |
| Prior Day Movers | Yesterday’s movers of 15% or more on real volume. |
| Volume Building | Relative volume is rising. |
| Most Volume | Highest volume today. |
News+Earnings
| Scan | Finds |
|---|---|
| Up On News | Moving up after a news item. |
| After Earnings | Bullish daily chart after recent earnings. |
| Earnings Soon | Bullish into upcoming earnings. |
Gaps
| Scan | Finds |
|---|---|
| Gap & Go | A gap up being bought: above VWAP with 15-minute momentum. |
| Gap Fade | A gap up being sold: below VWAP, 15-minute momentum broken. |
| Gap Fill | A gap down being bought back: above VWAP with 15-minute momentum. |
| Falling Into Gap | A gap down still being sold: below VWAP, momentum broken. |
| Old Gap Fill | Liquid names sitting inside or near a gap on the daily chart. |
Trend
| Scan | Finds |
|---|---|
| Strong Daily | Strong daily chart. |
| Daily Trade Signal | A chart Buy signal fired within the last 5 days on the daily chart. |
| Sector Leaders | The strongest stocks in the strongest sectors. |
| All Clear | RSI above 50 on the 15m, 1h, 4h and daily charts together. |
| Coiled Spring | A daily squeeze resolving from the inside: the 15m has fired inside the daily coil. |
| Quiet Buying | Institutional-size buying inside a tight daily range. |
| Turning Up | The 15-minute trend flipping bullish with volume. |
| Breakout Day | Trading above yesterday’s entire range. |
| Range Break | Breaking out of a multi-day compressed range. |
| Major MA Break | A recent break above the 50, 100 or 200-day SMA, with 4-hour relative strength agreeing. |
| New Highs | New yearly highs with weekly momentum. |
| 90-Day Leaders | Big multi-month gainers that are still outperforming. |
Pullbacks+Levels
| Scan | Finds |
|---|---|
| Leaders on Sale | Strong on the daily chart but weak over the past hour. |
| Bullish Pullback | Strong on daily bars, oversold on the 15m, resting near the 1-hour 21 EMA. |
| VWAP Pullbacks | Ran well above VWAP earlier today, now pulled back to it while still strong. |
| Bull Flag | A sharp 5-minute rise, then a tight, shallow pause on lower volume. |
| Daily Pullback | A high-volume key bar touching the 21 EMA after a pullback. |
| SMA Magnet | Near a major SMA on the daily chart. |
| Near Day High | Near the high of the day. |
| Open Air | On the daily chart, price breaking above its last resistance zone into open air. |
| Near Open Air | Approaching the top of the last resistance zone. |
Options
| Scan | Finds |
|---|---|
| Lottos | Weekly options that may spike in value near the close. |
Short scans
Most short scans look for the reverse of a long setup.
| Group | Scans |
|---|---|
| Top Scans | Trending Now, In Play, Opening Range, Top Shorts, Has Trade Signal, Most Popular, Ready to Trend |
| Movers | Price Pops, Big Move Down, Falling Strength, Unusual Volume, Volume Building, Most Volume, Weakest |
| News+Earnings | Down On News, After Earnings, Earnings Soon |
| Gaps | Gap Fade, Falling Into Gap, Old Gap Fill |
| Trend | Weak Daily, Sector Laggards, Coiled Spring, Quiet Selling, Turning Down, Breakdown Day, Range Break, Major MA Break, New Lows |
| Pullbacks+Levels | Dead Cat Bounce, Bearish Pullback, VWAP Pullbacks, Bear Flag, Daily Pullback, SMA Magnet, Near Day Low, Attack YD Low, Open Air, Near Open Air |
| Options | Lottos |
Has Trade Signal on the short side looks at the 5m, 10m and 15m charts only. There is no short version of Daily Trade Signal, because the signal has no short side on slower charts.
Sector scans and your flags
By Sector has one scan for each of the eleven sectors. Your Green Flags and Your Red Flags list the tickers you flagged.
Where to start
- In Play: what the market is trading today.
- Trending Now: the cleanest intraday trends.
- Most Popular: what other traders are looking at.
Scan Playground
The Scan Playground is a gallery of every built-in scan plus a set of starter scans modelled on what traders actually build. Open it from the top of the scan list, or from Learn → Find scans for my style.
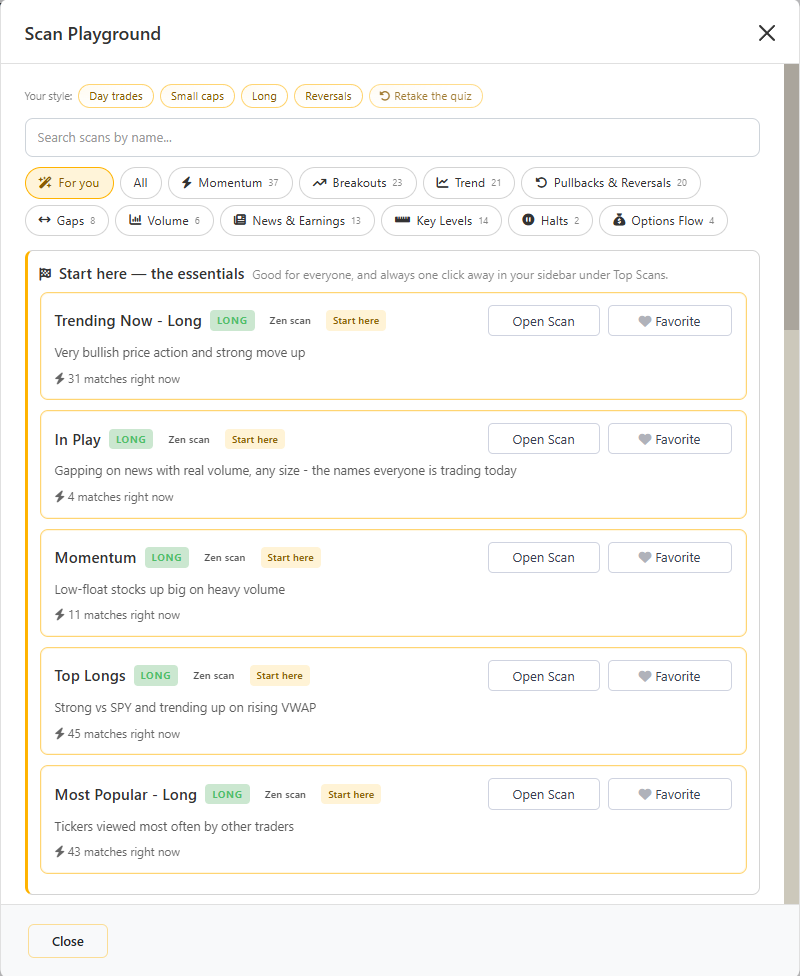
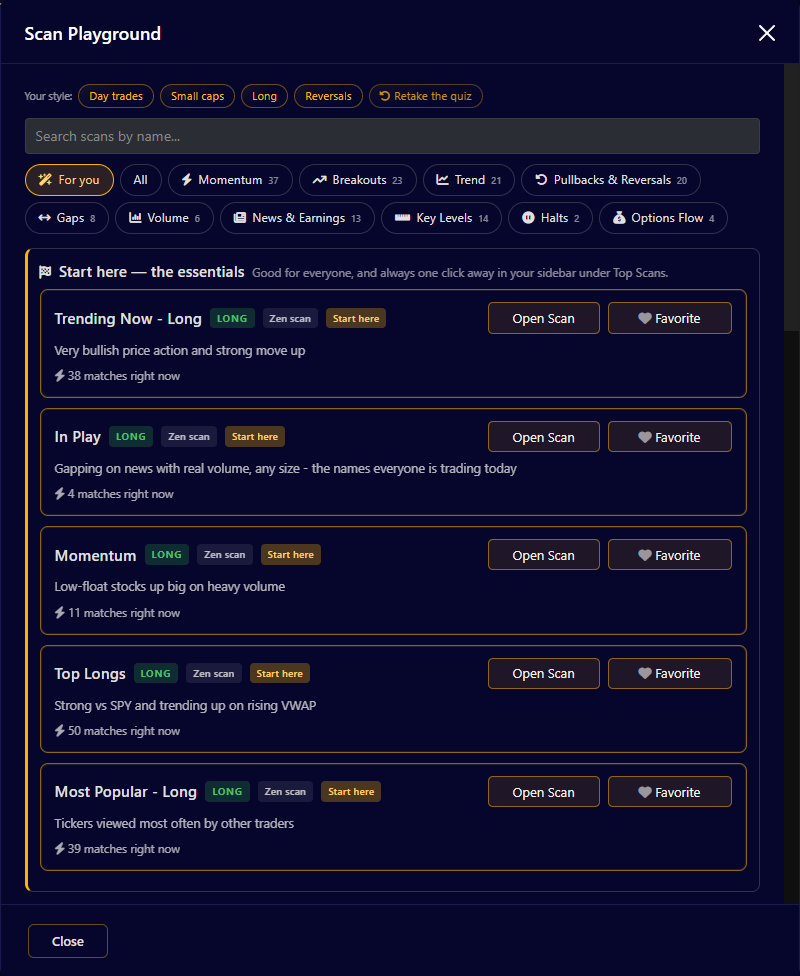
- The quiz. Answer a few questions about how you trade. It takes about 30 seconds, then the For you tab shows matching scans. You can retake it any time.
- Browse by category. Tabs along the top group the scans by style. A search box finds a scan by name.
- Open or favorite. Opening a built-in scan takes you to it. Favoriting a starter scan adds your own copy under Custom Scans, which you can then edit.
The Trading Strategies page (also in the Learn menu) comes at it from the other direction: eight well-known ways of trading, what each one looks for, and the scans and filters that fit. Click a scan name there to open it.
Multi-Scan view
Multi-Scan puts several scans on one screen. Each panel updates on its own. Open it from the top bar.
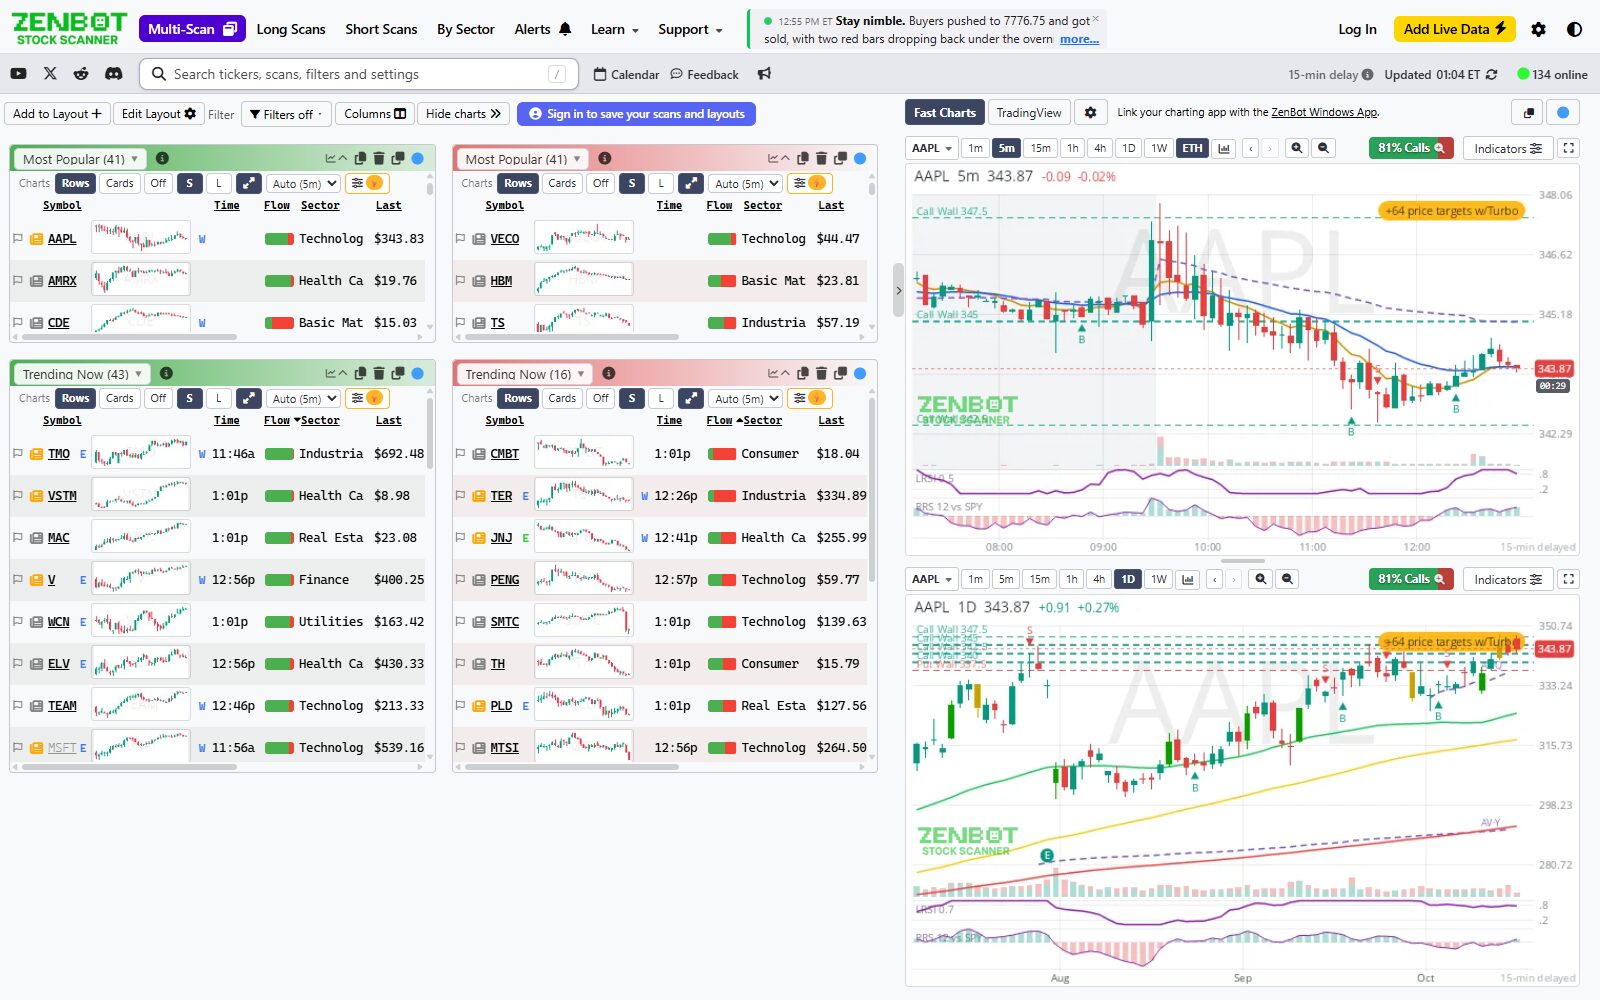
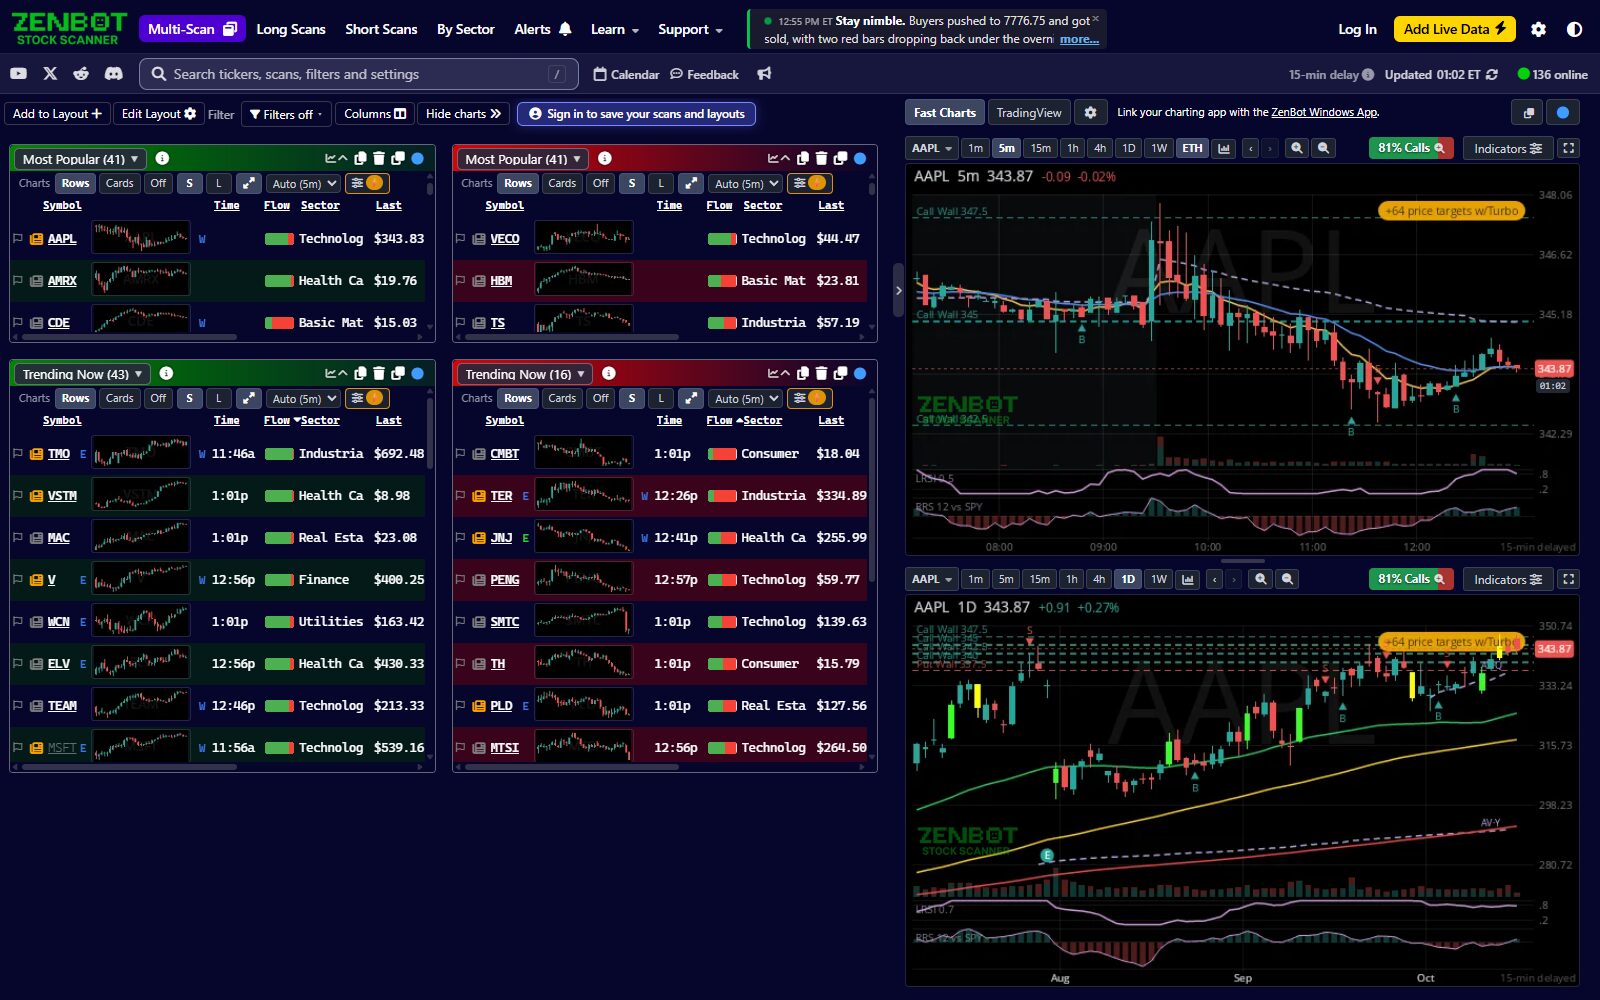
Setting it up
- Add a scan: right-click the scan in the list and choose Add to Multi-Scan.
- Arrange: drag panels by their heading; drag an edge to resize.
- Columns of panels: Edit Layout in the Multi-Scan toolbar (or gear → Multi-Scan Layout) sets how many panels sit side by side.
- Charts in a panel: each panel has a compact version of the chart bar, so a panel can show row previews.
The layout is saved with your account. The free plan holds up to 6 scans in 3 columns. Turbo allows more scans and 4 to 6 columns.
Ideas
Read the tape
Top Longs beside Top Shorts. A full long panel and a thin short panel tells you which side the market favours today.
Watch for entries
Has Trade Signal, Price Pops and Your Green Flags side by side.
Second monitor
Pop individual scans out into their own windows instead. See Pop-Out Windows.
Sector strength & sector scans
By Sector in the top bar shows how each of the eleven sectors is doing against the market, and has a scan for each.
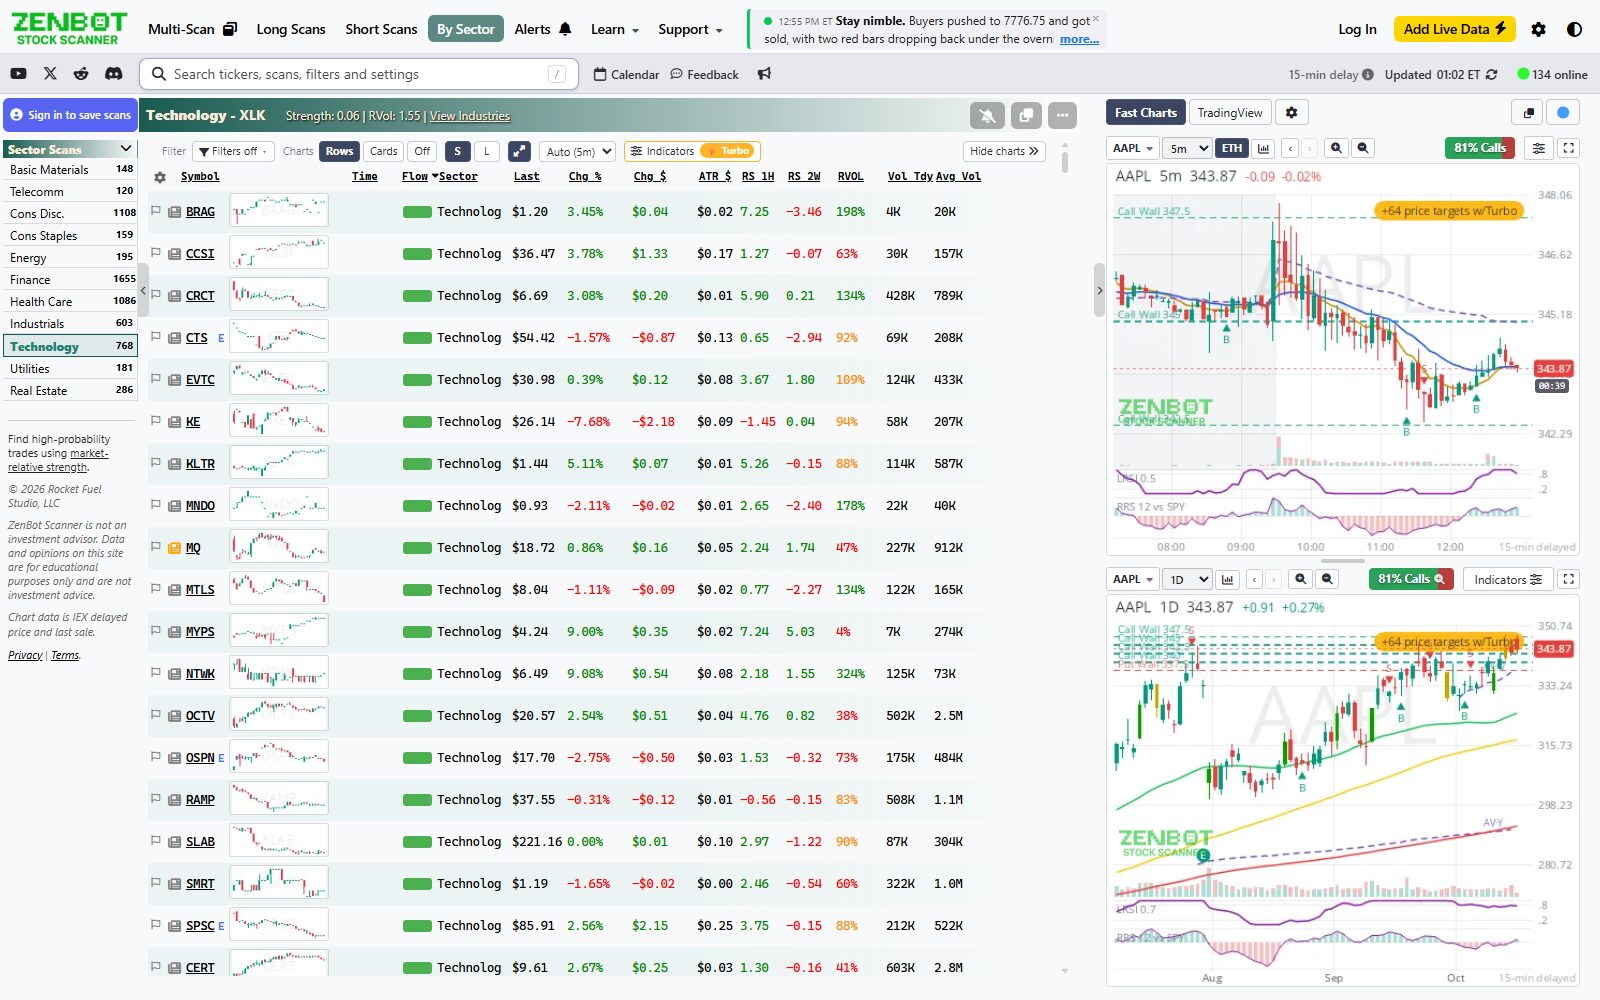
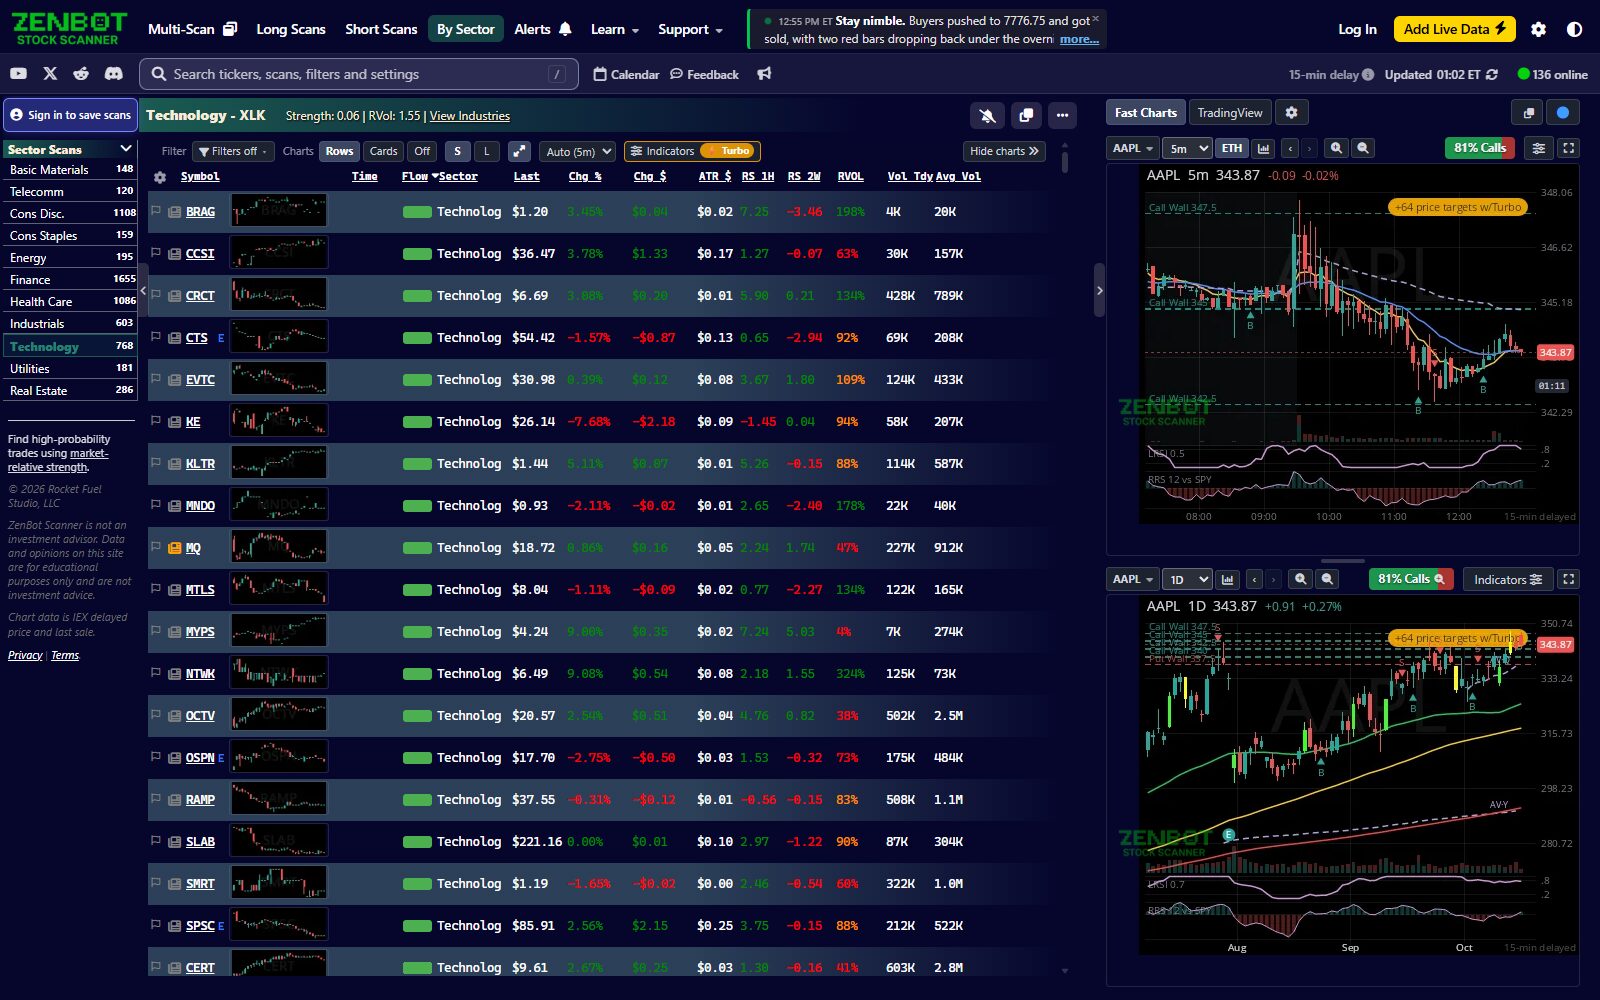
Strong stock, strong sector
- Find the strongest sector today.
- Open its scan.
- Sort by relative strength and look at the top of the list.
The reverse works for shorts: the weakest stock in the weakest sector. The Sector Leaders and Sector Laggards scans do this in one step across all sectors.
The sector scans
Basic Materials, Telecomm, Consumer Discretionary, Consumer Staples, Energy, Finance, Health Care, Industrials, Technology, Utilities, Real Estate. Filters work inside a sector scan like any other.
Price Pops
A price pop is a sudden move on heavy volume: the kind of bar that often marks news or a large order. Price Pops – Long and Price Pops – Short, under Movers, list them as they happen.
Before you act on one
- Is it a break out of a range, or one bar in the middle of nowhere?
- Is the stock strong against the market, or was this a one-off?
- Did volume carry into the next bar?
- Where is price against VWAP and the option levels?
A pop is a reason to look, not a reason to buy.
Alerts
Click the bell on either Price Pops scan to be told about each one. They can be frequent. If that is too much, put the bell on a tighter custom scan instead.