Filters
A filter narrows whatever scan you are on. Turn on “Above VWAP” and “Relative Volume > 2” and every scan you open shows only the tickers that also pass those two tests, until you turn them off.
Open the filter dialog
- Click Filters off ▾ above the results, then Edit Filter or New Filter.
- Search for a filter by name and pick it. The dialog opens on that row.
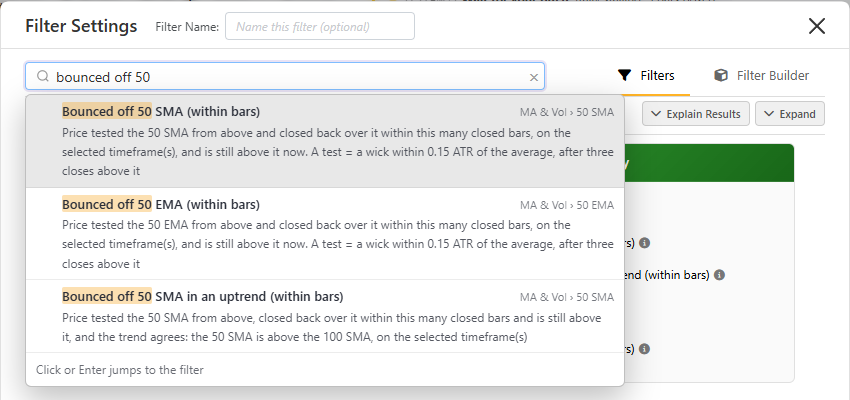
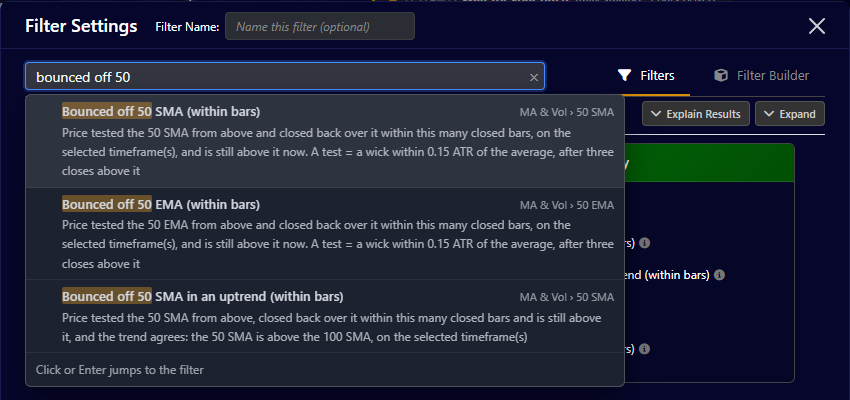
- Inside the dialog, the search box at the start of the tab row lists matching filters; click one or press Enter to jump to it. Esc first closes the list, then clears the box, then closes the dialog.
Find a filter
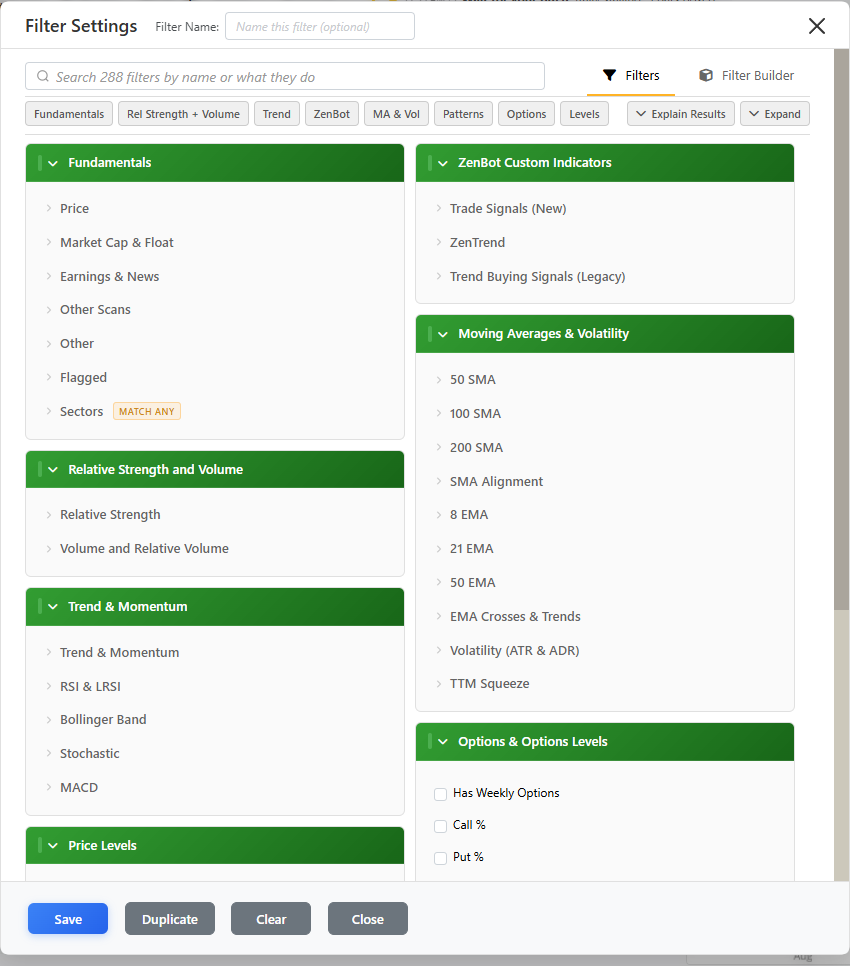
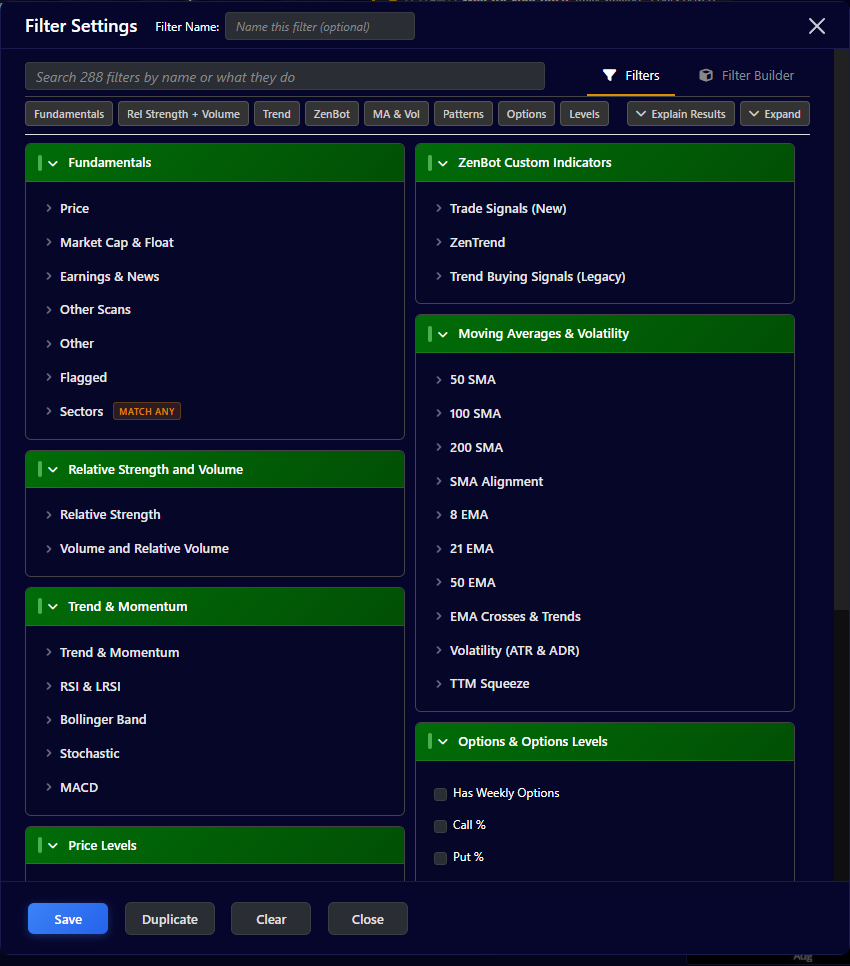
Filters are grouped by subject. Click a group to open it; the number beside it tells you how many filters are on.
| Group | What’s in it |
|---|---|
| Fundamentals | Price, market cap and float, earnings and news, recent and upcoming stock splits, on another scan / not on another scan, your flags, sectors. |
| Relative Strength and Volume | Strength against SPY, relative volume, volume building, high RVOL in the last 3, 5, 10 or 20 bars. |
| Trend & Momentum | RSI and Laguerre RSI, Bollinger Band (including above the upper band and below the lower band), Stochastic and Slow Stochastic 34/10/3, MACD. |
| Price Levels | Gaps, price change, today’s and yesterday’s levels, VWAP and anchored VWAP. |
| ZenBot Custom Indicators | ZenTrend (bull and bear cycle, turning up and down), Trade Signals (New), and Trend Buying Signals (Legacy). |
| Moving Averages & Volatility | One sub-group for each line: 50, 100 and 200 SMA; 8, 21 and 50 EMA. Each has near, above, below, bounced off and rejected at. Also SMA alignment, EMA crosses, ATR and ADR, TTM Squeeze. |
| Options & Options Levels | Weekly options, call and put percentage, distance to option levels, bounces and rejections at them. |
| Patterns | Candle and chart patterns. |
| Other | Not a leveraged or inverse ETF. |
Not sure what a filter means? Hover the small i beside it to see what it tests.
Choose a timeframe
Most technical filters work on more than the 5-minute chart. Switch one on and a chip underneath shows its timeframe.
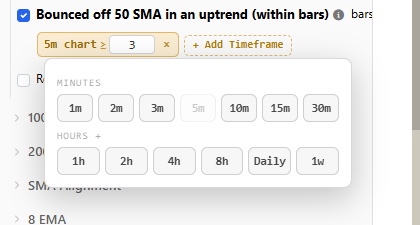
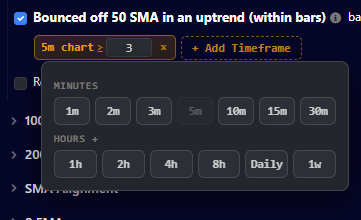
- Change the timeframe: pick another from the chip. The value stays.
- Require it on a second timeframe as well: click + Add Timeframe. A ticker must pass on every timeframe you add.
- Remove one: click the × on its chip.
You can use 1m, 2m, 3m, 5m, 10m, 15m, 30m, 1h, 2h, 4h, 8h, Daily or Weekly. For example, “Above 50 SMA” on Daily plus “RSI above 50” on 15m and 1h finds stocks in a daily uptrend that are also strong right now.
Bounced and rejected
“Bounced off 50 SMA (within bars)” means price tested the line within that many bars of the chosen timeframe and is still above it now. A bounce that has since broken back through no longer counts. “Rejected at” is the mirror: tested from below and still under it. Use them to find a reaction at a line, where “near” only finds closeness.
The in an uptrend versions add the bigger trend. “Bounced off 100 SMA in an uptrend (within bars)” and the 200 SMA one also need price back over the 50 SMA. The 50 SMA one needs the 50 SMA over the 100. “Rejected at … in a downtrend” is the mirror for shorts. Find them under each line’s own sub-group in Moving Averages & Volatility.
Builder mode
Filters requires every switch you turn on to pass. Use Builder when you need AND and OR groups, such as “strong against SPY, and either high relative volume or gapping up”.
Closing without saving
If you change something and then close the dialog with the ×, Esc or Close, ZenBot asks before throwing the changes away.
Saved filters
Say I only want stocks over $20 with real volume. I build that filter once, save it as “Over $20, real volume”, and can use it on any scan.
The Filter button above every scan shows what’s applied: your saved filter’s name, Unsaved, or Filters off. Click it for:
- New Filter… and, while a filter is on, Edit Filter…
- Save Filter As… to keep the filters that are on right now under a name.
- Saved: your named filters. Click one to apply it; the pencil renames it and the bin deletes it.
- Recent: the last five you used without naming them, with a + to name one.
- Filters off: show every result again. The × beside the button does the same.
A filter you apply follows you across the Long, Short and sector scans and Multi-Scan, so you can switch scans without losing it. A pop-out window keeps its own filter.

The filter strip
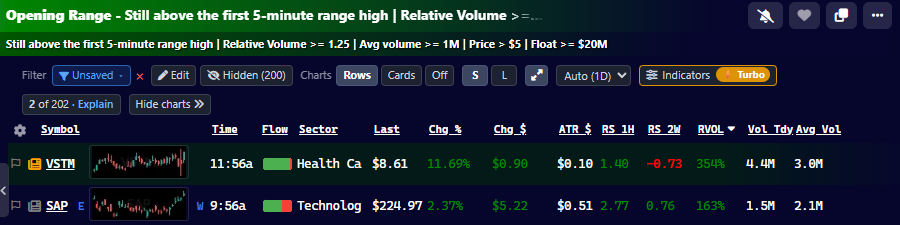
When a filter is on, a strip under the scan heading shows it, with Edit and Hidden (N), the number of rows the filter is hiding, so you always know what you’re not seeing. Click Hidden to see them.
The free plan keeps three saved filters. Turbo keeps up to twenty.
Scan Explainer
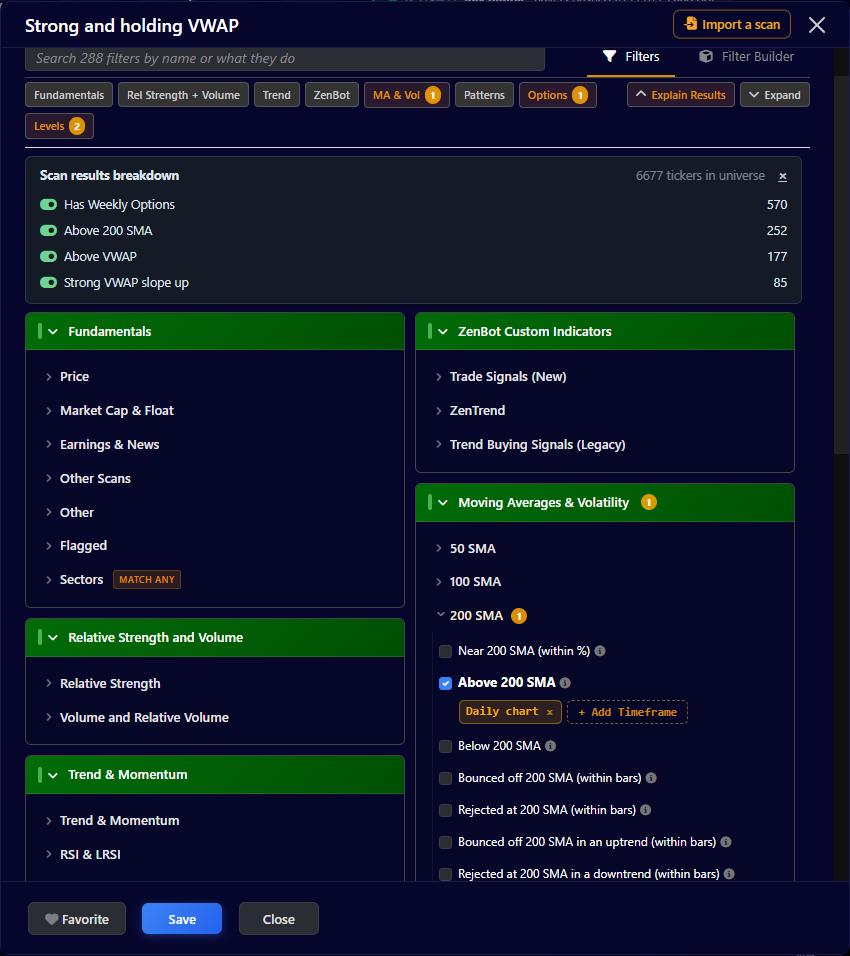
This one used to drive me crazy. You build a scan and get three names. Or none. Why? Click 59 of 6,677 · Explain above the results. The Scan results breakdown shows how 6,677 tickers became 59, one condition at a time.
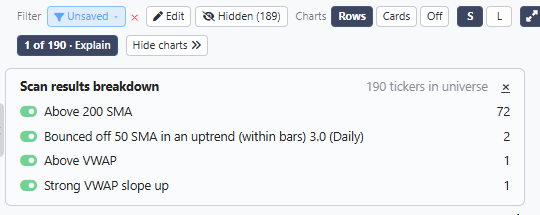
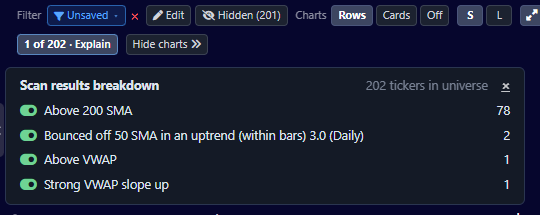
Explain checks the scan’s conditions, then your filter’s, and shows how many tickers survive each step:
- Why is this scan empty? Look for the step where the count drops to zero. That is the condition to loosen.
- Which condition is doing the work? A step that barely changes the count isn’t adding much. A step that cuts 2,000 tickers to 40 is the heart of the scan.
- Switch a condition off right there. The switch beside each step turns it off for a moment (nothing is saved) and every count runs again, so you can see what comes back.
- Click a step to edit it.
- “← removes all” marks the step that leaves nothing.
- Filter Builder scans work too, nested groups included: a group’s conditions are listed under it.
- With a filter on as well, a second part, Filter results breakdown, starts from what the scan passed.
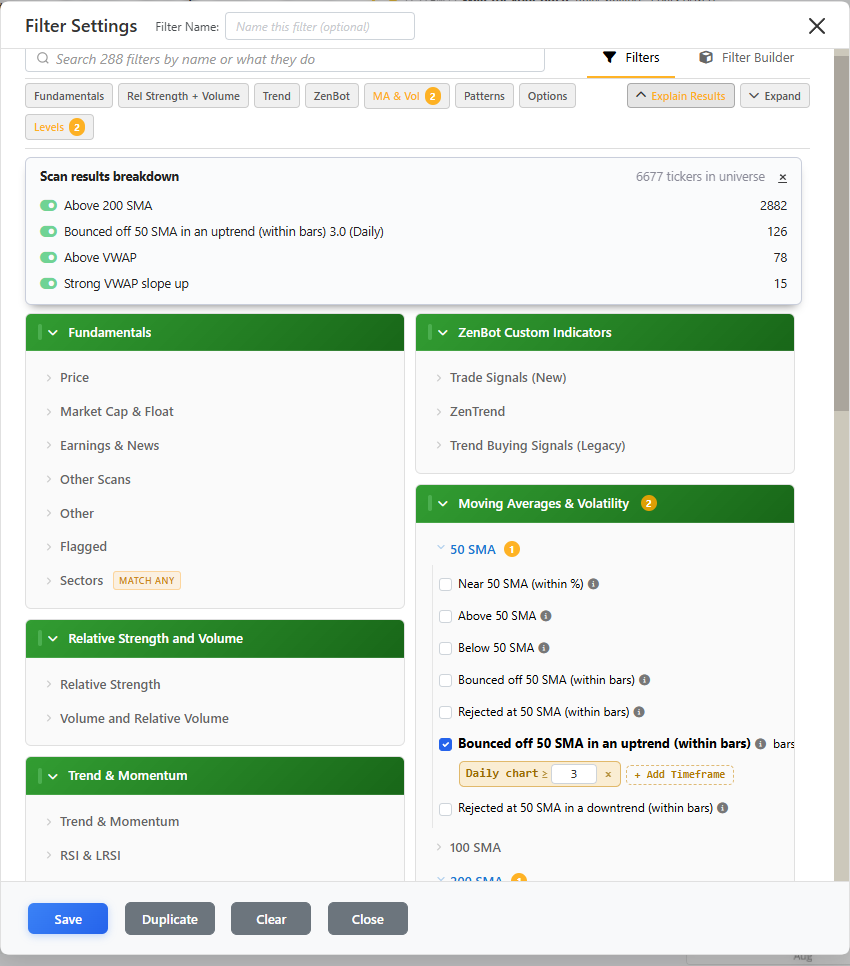
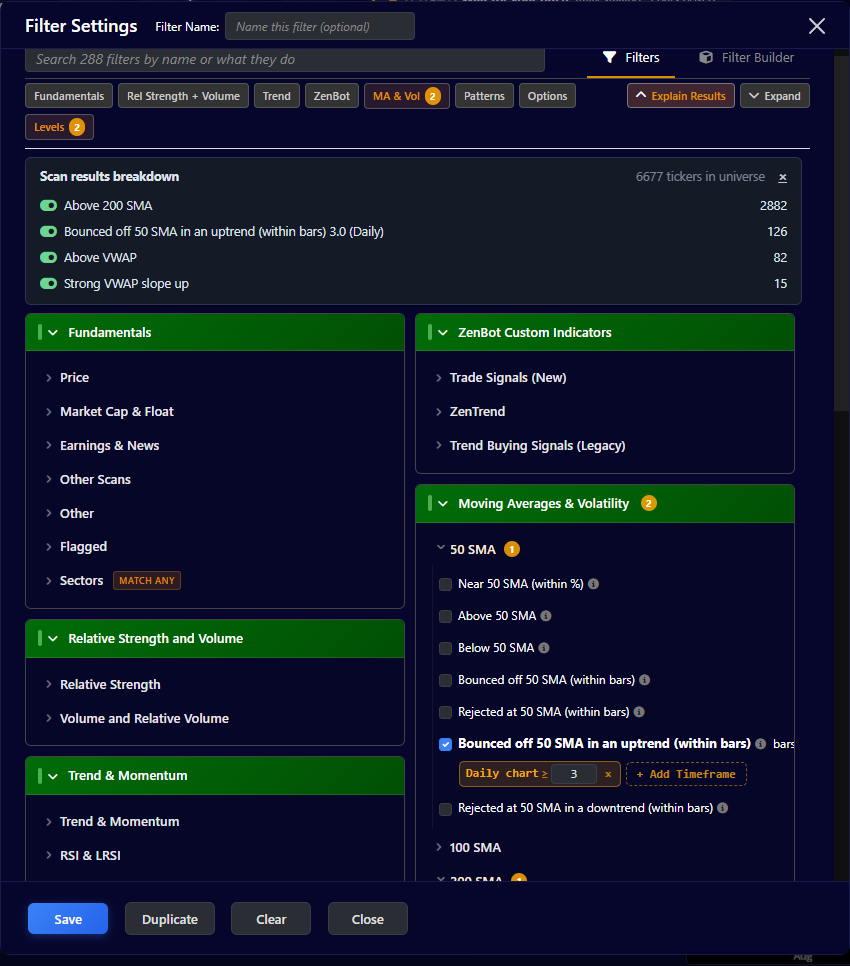
An empty scan has a See which condition removed them button that opens the same breakdown. The same breakdown is inside the filter dialog while you build, and Explain this scan is in the right-click menu of any scan.
Custom scans
Build a scan from your own conditions and it appears under Custom Scans at the top of the list.
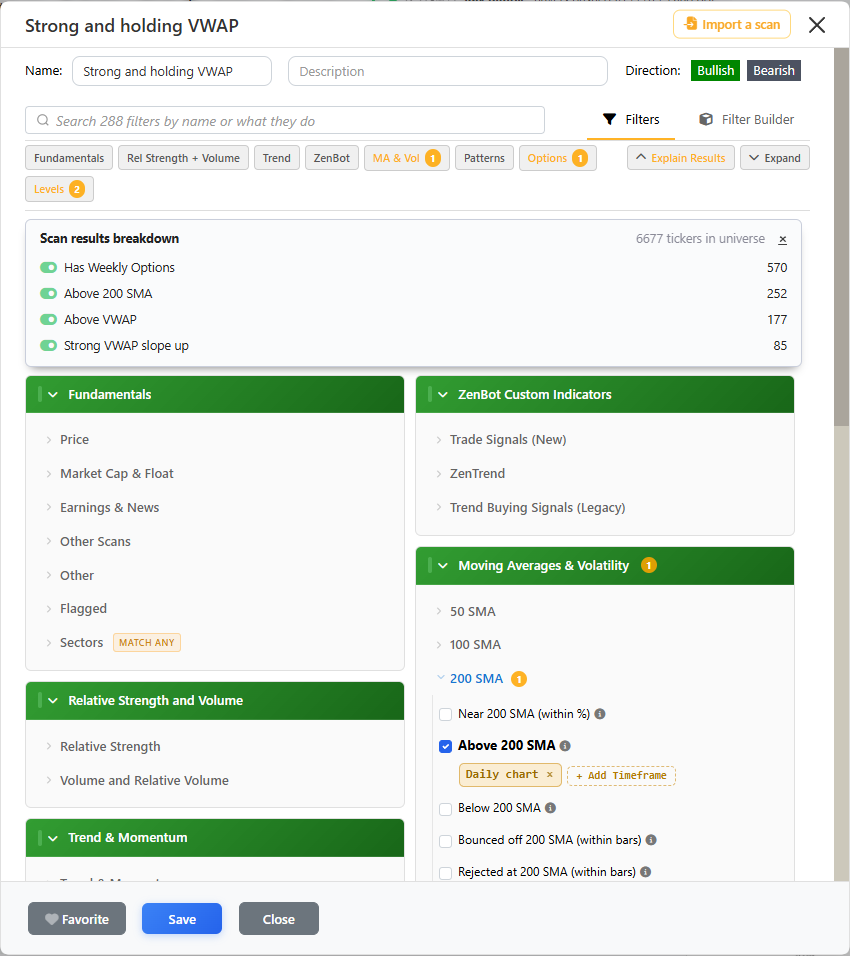
Building one
- Click Build / Import Scan at the top of the scan list.
- The name is selected, ready to type over. Give the scan a name you will recognize.
- Switch on the filters you want and set their values and timeframes.
- Watch the Explain panel as you go. It shows how many tickers pass.
- Click Save.
Nothing is created until you save. If you close a new scan with changes in it, ZenBot asks first.
Starting from someone else’s scan
- Import: at the top of the Build dialog, Import a scan takes a shared scan link or code.
- Scan Playground: favorite a starter scan to get your own copy to edit.
- A built-in scan: the heart on a built-in scan’s heading adds it to your scans, where you can add a filter of your own on top.
Examples
Day trade
Morning strength- Strong vs SPY (1h)
- Relative Volume above 2
- Above VWAP
- Price above $10
- Average volume above 1M (without it, thin stocks with huge RVOL readings flood the list)
Swing trade
Daily pullback in an uptrend- Above 50 SMA (Daily)
- Bounced off 21 EMA within 3 bars (Daily)
- Average volume above 1M
Signal-led
Fresh buy signal on a strong chart- Trade Signal: new buy within 3 bars (15m)
- ZenTrend Bull Cycle
- Has weekly options
Want to change one? Copy its link into Import a scan at the top of the Build dialog and you get your own copy to edit.
Sharing, editing and deleting
The buttons on the scan’s heading, and the ⋯ menu beside them, hold the actions for the scan you are on: alerts, favorite, pop out, edit, copy symbols, columns, share and delete.
- Share scan gives you a link with a Copy button. Anyone who opens it can add the scan to their own account.
- Edit scan reopens the dialog. Duplicate in the dialog makes a copy to experiment on.
- Delete asks first.
You can also right-click a scan in the list for the same actions.
Alerts on a custom scan
Click the bell on the scan’s heading. ZenBot then tells you when a new ticker joins it. See Alerts.