Trade Signals
Trade Signals marks trade ideas right on the chart: a B for a Buy or an S for a Short, on the bar where the setup triggered. It’s on by default on Fast Charts, and can be switched on and off in the chart’s Indicators menu. On TradingView charts it’s Trade Signals (Beta), which also marks where each trade would have ended with an E and shades the bars while it was open, so you can see how it played out.
These are experimental trade examples, not recommendations. I use them to find charts worth a look. Then I do my own homework, and you should too.
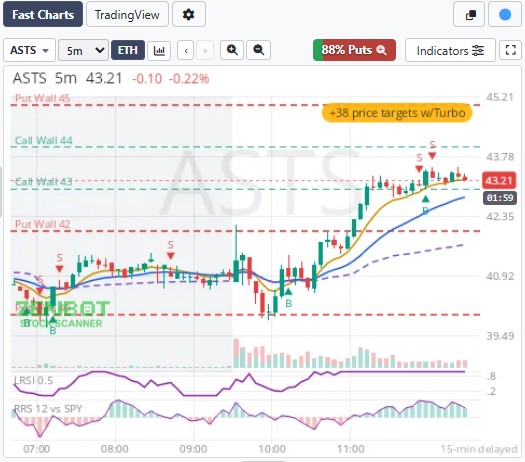
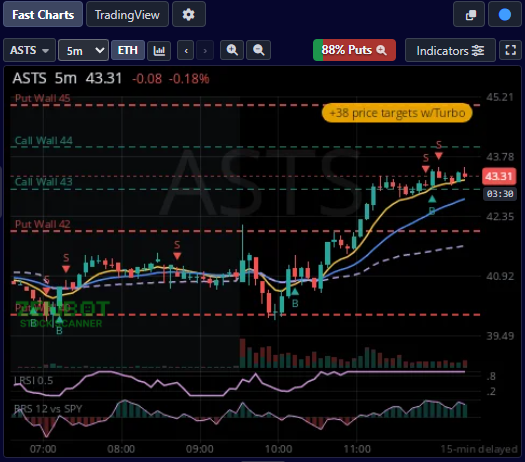
How the signals work
- On the 5, 10 and 15 minute charts it looks for a pullback in a stock that’s already moving: trending, on the right side of VWAP, a dip of a couple of bars, then a turn back the way it was going. That turn is the signal, and it can be a Buy or a Short.
- Only real movers qualify. The stock needs volume well above its usual pace and real dollar volume behind the move.
- Every signal comes with an example exit: a target, a stop, or the end of the day, whichever comes first. TradingView charts mark it with an E.
- On slower charts (30 minutes and up, including daily) the signals are trend entries, and they’re Buys only.
- Intraday signals fire during regular hours only, and not in the last few minutes of the day.
Scanning for signals
| Scan | Finds |
|---|---|
| Has Trade Signal – Long | A buy that fired within the last 5 bars on the 5m, 10m, 15m, 30m or 1h chart. |
| Has Trade Signal – Short | A short that fired within the last 5 bars on the 5m, 10m or 15m chart. This list is usually short. |
| Daily Trade Signal | A buy that fired within the last 5 days on the daily chart. |
Try this: open Has Trade Signal and switch to Cards. Now you have a wall of charts that all just triggered.
Signals in your own scans
The same signals are filters, under ZenBot Custom Indicators → Trade Signals (New): Buy signal on and Short signal on (the chart is in an open trade now), and New buy and New short (the signal fired within the last few bars; you choose how many). Pick the timeframe like any other filter: Buys work from 5 minutes up to daily, Shorts on 5 to 15 minutes. So “a new Buy on the 15-minute, above the 200 SMA, with high relative volume” is a scan you can build in about a minute, and put an alert on.
Read the chart
A signal says a setup formed. Check the chart, relative strength and volume before you decide what to do.ZenTrend
ZenTrend shows where price sits in a trend cycle and marks the start of a new one.
Scans and filters
- Ready to Trend – Long: a bull cycle is starting.
- Ready to Trend – Short: a bear cycle is starting.
- Filters, under ZenBot Custom Indicators → ZenTrend: Bull Cycle, Bear Cycle, turning up, turning down.
On the chart
Switch ZenTrend on from a Fast Chart’s Indicators menu. It appears in a pane under the price.
Using it
- Open Ready to Trend.
- Sort by relative strength to bring the strongest names up.
- On each chart, check whether the cycle is only starting or already stretched.
- Look for agreement from options positioning and volume.
Options flow & price targets
Watch: finding price targets and support levels
Options open interest can show which way positioning leans and the prices where it is concentrated. ZenBot puts both on the chart.
The Flow column
The bar in the Flow column shows the balance between call and put positioning for that stock. Mostly green leans bullish; mostly red leans bearish. The same balance appears as a Calls % or Puts % button above each Fast Chart.
Use it alongside the chart, not instead of it. A strong stock with call-heavy positioning has two things lining up. A strong stock with put-heavy positioning deserves a second look.
Options detail
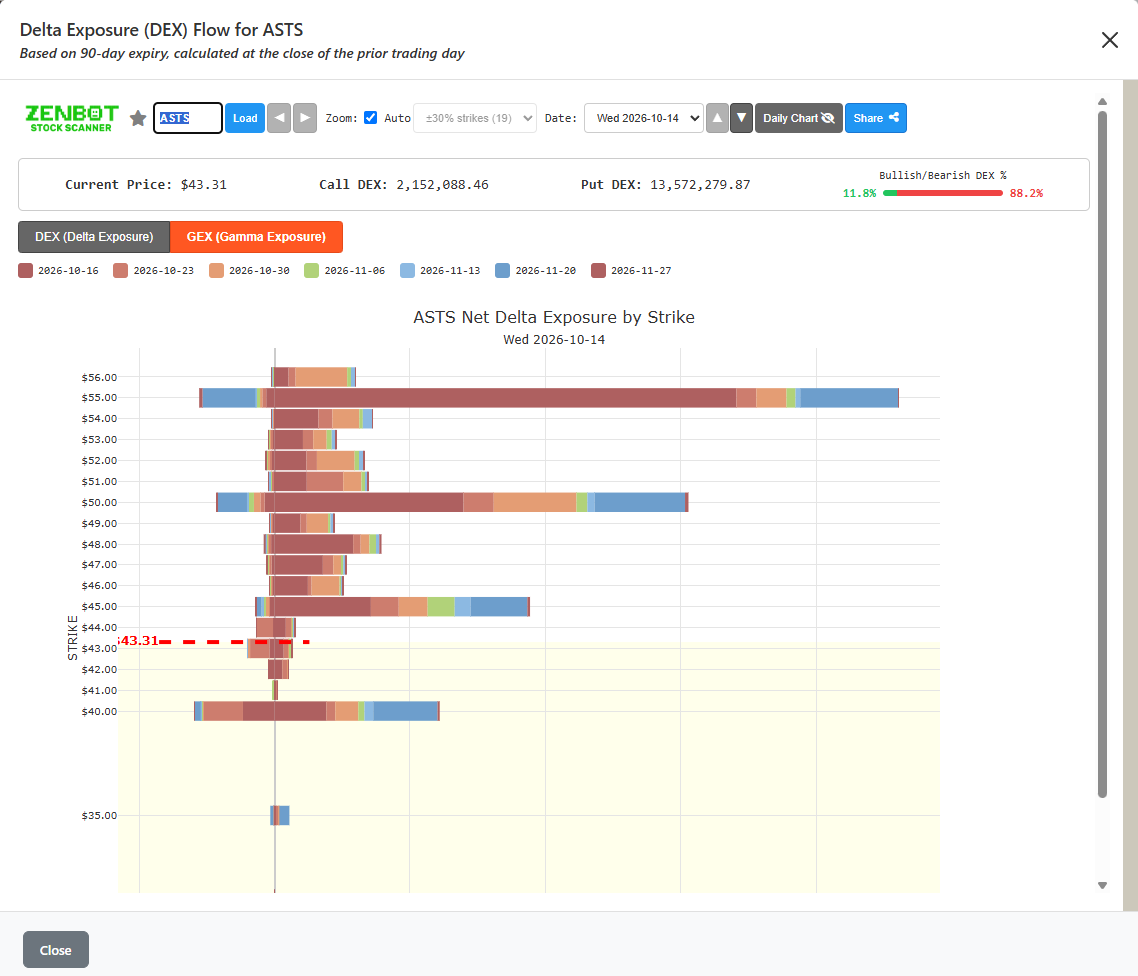
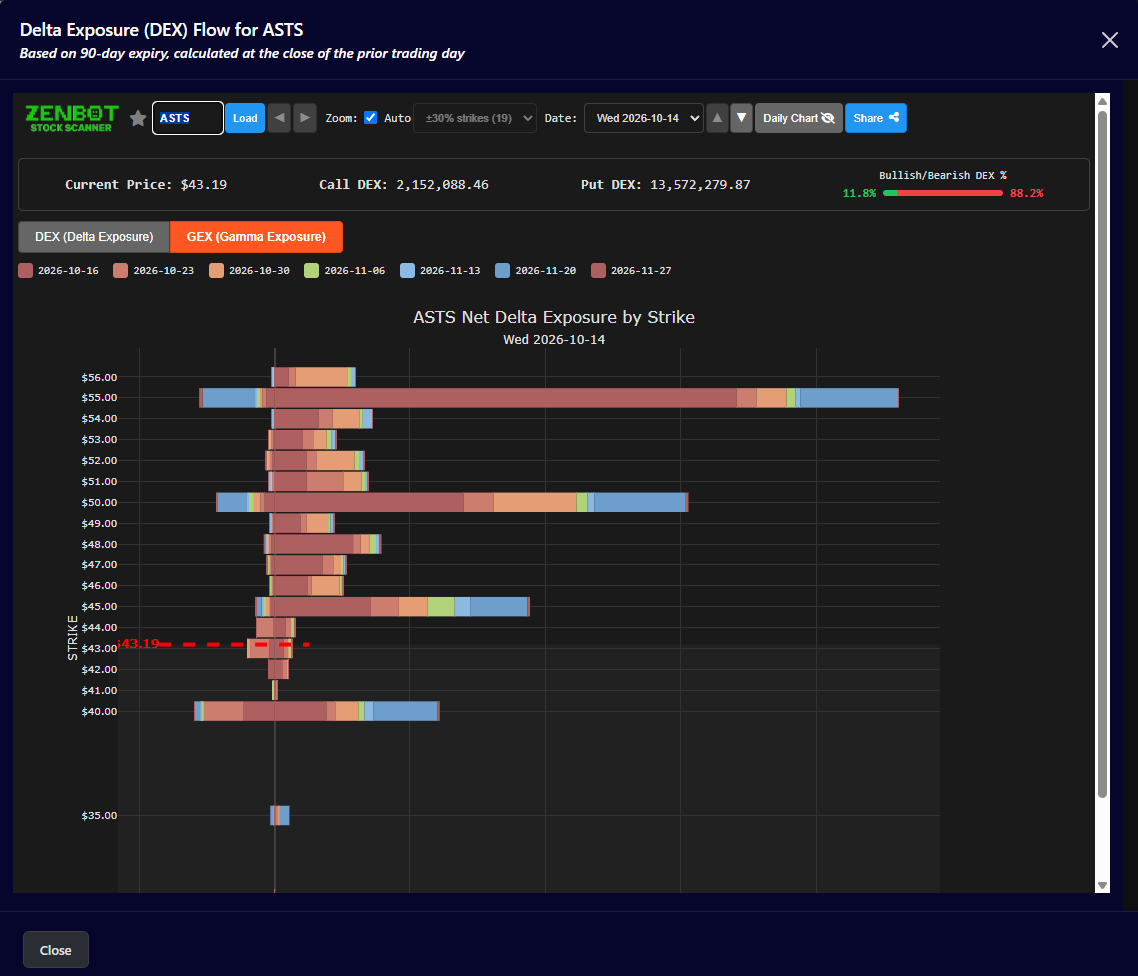
Click the Flow bar or the Calls / Puts button, or right-click a ticker and choose Options flow, to open the detail for that stock: delta exposure (DEX) by strike, colored by expiry, worked out from options open interest at the previous day’s close. The GEX tab shows gamma exposure the same way.
Target levels
Target levels mark the strikes with the heaviest open interest, above and below the current price. Price can move toward them or stall there.
- The free plan shows the nearest few levels on each side.
- Turbo shows the full set.
The Options & Options Levels filter group can find stocks near a level, bouncing off one or rejected at one.