How to read this page
Every filter in the filter dialog is listed here, group by group, in the order the dialog shows them. Each row says what the filter checks, the settings behind it, which timeframes it works on and when it updates. To learn how to open the dialog and switch filters on, start with Filters. In the dialog itself, hover the small i beside a filter for a one-line version.
- Timeframes. Chart filters run on the 5-minute chart unless the row says Daily. Click + Add Timeframe to add more chips, and a stock must pass on every chip you add. “Fixed” means the filter has one built-in timeframe and takes no chips. “None” means it reads a value with no timeframe, like float or sector.
- Live or bar close. “Live” includes the bar that is still forming, so the result can change during the bar. “Bar close” changes once per completed bar. “Daily” changes once a day.
- Typed values. “Above” means at or above, and “below” means at or below, on every timeframe. Each row gives the default and the unit. On slope filters a typed 0 is a real value: 0 means flat or rising (or flat or falling). On the “near … within %”, ATR and Float % filters, 0 switches the filter off.
- Missing data never passes. A stock with no VWAP yet, no open yet, no prior day, too little history for an average, or no market cap or float on file is left out. The one exception is Float Size – Min (or unknown), which lets unknown floats through on purpose.
- Some pattern filters only need one match. Turn on several of the 5-minute pattern and Heiken Ashi filters (Consolidating, Rising and Falling closes, VWAP hard rejection, Bull and Bear Flag, and the Heiken Ashi break, reversal, continuation and bars-since filters) and a stock needs to match just one of them. The same goes for Recent SMA break – Bullish and – Bearish. Every other filter must match, timeframe chips included. The sector boxes are the other exception: tick several and a stock in any of them passes.
“Left out” lines say which stocks a filter skips. They are worth a look when a scan comes back emptier than you expected.
Timeframes, in pictures
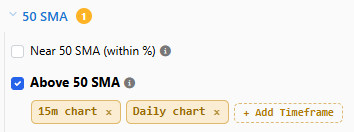
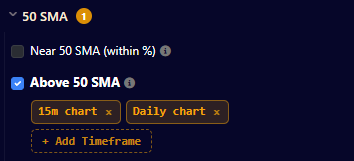
Switch a filter on and its timeframe chips appear under it. Each chip is one chart the stock must pass on. A filter that takes a number carries its own value on each chip, so you can ask for a stronger reading on one timeframe than another.
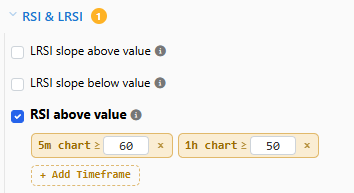
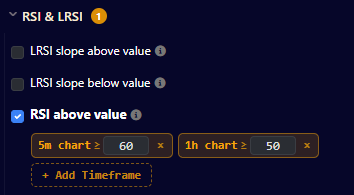
Click + Add Timeframe to pick another chart, from 1 minute to weekly. Click a chip to change its timeframe, and the × to remove it.
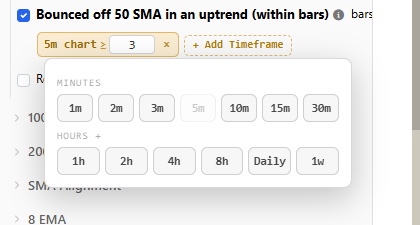
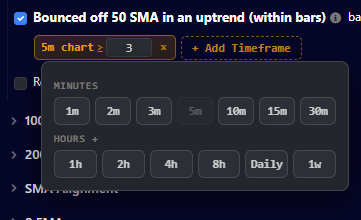
Some filters start on the daily chart instead of the 5-minute one. Their first chip says Daily chart, and the row on this page says “Daily by default”.
Terms used on this page
| Term | Meaning |
|---|---|
| SMA / EMA | Simple and exponential moving average. “50 SMA” is the average close of the last 50 bars. |
| VWAP | Volume-weighted average price for today, starting at 4:00 ET (premarket included). |
| AVWAP | Anchored VWAP: the same average, started from a chosen day such as an earnings report or the start of the year. |
| ATR / ADR | Average true range and average daily range: how far a stock typically moves in one bar or one day. |
| RSI / LRSI | Relative Strength Index (0 to 100) and Laguerre RSI (0 to 1), momentum readings. Not the same thing as relative strength against SPY. |
| ADX, +DI, -DI | Average Directional Index measures how strong a trend is. +DI and -DI measure the buying and selling pressure behind it. |
| MACD | Moving average convergence divergence, a momentum indicator built from two EMAs. |
| TTM Squeeze | On when the Bollinger Bands sit inside the Keltner Channel, a sign that price is coiling. |
| HA | Heiken Ashi, smoothed candles that make trends and reversals easier to see. |
| GEX / DEX | Options gamma exposure and delta exposure, used to find the big options levels. |
| RS / RW | Relative strength and relative weakness: how the stock is doing compared with SPY. |
| RVol / RRVol | Relative volume (volume compared with normal for this time of day), and relative volume divided by SPY’s. |
| ET | US Eastern Time, New York’s clock. |
Fundamentals
Price
| Filter | What it checks | Settings and timing |
|---|---|---|
| Minimum price | The last price is at or above your number. | Value: dollars, default 5 Timeframes: none (a stock-level value) Updates: Live |
| Maximum price | The last price is at or below your number. | Value: dollars, default 500 Timeframes: none (a stock-level value) Updates: Live |
Market Cap & Float
| Filter | What it checks | Settings and timing |
|---|---|---|
| Market Cap – Min | Market cap (shares outstanding times the last price) is at or above your number. | Value: millions of dollars, default 50 Timeframes: none (a stock-level value) Updates: Live with price; share counts refresh daily Left out: no market cap on file |
| Market Cap – Max | Market cap is at or below your number. | Value: millions of dollars, default 500 Timeframes: none (a stock-level value) Updates: Live with price; share counts refresh daily Left out: no market cap on file |
| Float Size – Min | Float, the shares available to trade, is at or above your number. | Value: millions of shares, default 10 Timeframes: none (a stock-level value) Updates: Daily Left out: no float on file |
| Float Size – Min (or unknown) | Float is at or above your number, or the stock has no float on file. Use it when you don’t want missing float data to hide a stock. | Value: millions of shares, default 20 Timeframes: none (a stock-level value) Updates: Daily |
| Float Size – Max | Float is at or below your number. | Value: millions of shares, default 100 Timeframes: none (a stock-level value) Updates: Daily Left out: no float on file |
| Float % – Min | Float as a percent of shares outstanding is at or above your number. | Value: percent, default 5; 0 switches it off Timeframes: none (a stock-level value) Updates: Daily Left out: no float or share count on file |
| Float % – Max | Float as a percent of shares outstanding is at or below your number. | Value: percent, default 20; 0 switches it off Timeframes: none (a stock-level value) Updates: Daily Left out: no float or share count on file |
Earnings & News
| Filter | What it checks | Settings and timing |
|---|---|---|
| Earnings Recently | The last earnings report was no more than this many calendar days ago. The report date is day 0, and an after-close report counts from the next weekday. | Value: days, default 5 Timeframes: none (a stock-level value) Updates: Daily Left out: no past report on file |
| Earnings Soon | The next earnings report is due within this many days, today included. Report dates are known about a month ahead. | Value: days, default 5 Timeframes: none (a stock-level value) Updates: Daily Left out: no upcoming report on file |
| Recent Split | A stock split, forward or reverse, took effect within this many calendar days. The split day is day 0. | Value: days, default 30 Timeframes: none (a stock-level value) Updates: every 30 minutes |
| Upcoming Split | A split has been announced and has not taken effect yet. The data source lists these about one trading day ahead. | Timeframes: none (a stock-level value) Updates: every 30 minutes |
| No Recent Split | Leaves out stocks whose split took effect within this many calendar days (0 = the split day only). Stocks with no recent split pass. | Value: days, default 1 Timeframes: none (a stock-level value) Updates: every 30 minutes |
| Has News Today | A news story on the stock was published in the last 14 hours, so last evening’s news counts. | Timeframes: none (a stock-level value) Updates: Live, as news arrives |
Other Scans
| Filter | What it checks | Settings and timing |
|---|---|---|
| On Another Scan | Keeps only stocks that are on the scan or scans you pick, right now. Any = on at least one; All = on every one. | Value: pick one or more scans, then Any or All Scan-membership filters inside the picked scan are ignored (one level only) Timeframes: none (a stock-level value) Updates: Live |
| Not On Another Scan | Leaves out stocks that are on any of the scans you pick, right now. | Value: pick one or more scans Scan-membership filters inside the picked scan are ignored (one level only) Timeframes: none (a stock-level value) Updates: Live |
Other
| Filter | What it checks | Settings and timing |
|---|---|---|
| Not a leveraged or inverse ETF | Leaves out a fixed list of common leveraged and inverse ETFs, such as TQQQ, SQQQ, SOXL and UVXY, plus SPY, ARKK and ARKG. A leveraged ETF that is not on the list still passes. | Timeframes: none (a stock-level value) Updates: fixed list |
Flagged
| Filter | What it checks | Settings and timing |
|---|---|---|
| Flagged Green | Keeps only stocks you have flagged green. | Timeframes: none (a stock-level value) Updates: as soon as you flag |
| Not Flagged Green | Leaves out stocks you have flagged green. | Timeframes: none (a stock-level value) Updates: as soon as you flag |
| Flagged Yellow | Keeps only stocks you have flagged yellow. | Timeframes: none (a stock-level value) Updates: as soon as you flag |
| Not Flagged Yellow | Leaves out stocks you have flagged yellow. | Timeframes: none (a stock-level value) Updates: as soon as you flag |
| Flagged Red | Keeps only stocks you have flagged red. | Timeframes: none (a stock-level value) Updates: as soon as you flag |
| Not Flagged Red | Leaves out stocks you have flagged red. | Timeframes: none (a stock-level value) Updates: as soon as you flag |
Sectors
| Filter | What it checks | Settings and timing |
|---|---|---|
| Sectors | Keeps stocks in the sectors you tick: Basic Materials, Consumer Discretionary, Consumer Staples, Energy, Finance, Health Care, Industrials, Miscellaneous, Real Estate, Technology, Telecommunications or Utilities. With several ticked, a stock in any of them passes. | One checkbox per sector Timeframes: none (a stock-level value) Updates: Daily Left out: no sector on file |
Relative Strength and Volume
Relative Strength
| Filter | What it checks | Settings and timing |
|---|---|---|
| Relative Strength increasing | Relative strength against SPY is trending up (its slope is above 0). This is the direction of relative strength, not its level, so a weak stock getting less weak passes. | Relative strength over 12 bars: the stock’s move over 12 bars in units of its own ATR, minus SPY’s move in SPY’s ATR; slope over the last 5 readings Timeframes: 5m by default; add any chip Updates: Live on 5m, bar close on other chips Left out: not enough bars for the slope yet |
| Relative Strength falling | Relative strength against SPY is trending down (its slope is below 0). This is the direction of relative strength, not its level, so a strong stock losing a little strength passes. | Relative strength over 12 bars: the stock’s move over 12 bars in units of its own ATR, minus SPY’s move in SPY’s ATR; slope over the last 5 readings Timeframes: 5m by default; add any chip Updates: Live on 5m, bar close on other chips Left out: not enough bars for the slope yet |
| Relative Strength vs SPY | The stock is outperforming SPY over the last 12 bars by at least your number, measured in multiples of the ATR. | Relative strength over 12 bars: the stock’s move over 12 bars in units of its own ATR, minus SPY’s move in SPY’s ATR Value: in multiples of the ATR, compared with SPY, default 0.5; each chip can carry its own value Timeframes: 5m by default; add any chip Updates: Live on 5m, bar close on other chips Left out: fewer than 13 bars lined up with SPY |
| Relative Weakness vs SPY | The stock is underperforming SPY over the last 12 bars: relative strength is at or below your number. | Relative strength over 12 bars: the stock’s move over 12 bars in units of its own ATR, minus SPY’s move in SPY’s ATR Value: in multiples of the ATR, compared with SPY, default -0.5; each chip can carry its own value Timeframes: 5m by default; add any chip Updates: Live on 5m, bar close on other chips Left out: fewer than 13 bars lined up with SPY |
| Relative strength slope above value | The slope of relative strength(12) is at or above your number. 0 means flat or rising. | Relative strength over 12 bars: the stock’s move over 12 bars in units of its own ATR, minus SPY’s move in SPY’s ATR; slope over the last 5 readings Value: relative strength units per bar, default 0.05 Timeframes: 5m by default; add any chip Updates: Live on 5m, bar close on other chips |
| Relative strength slope below value | The slope of relative strength(12) is at or below your number. 0 means flat or falling. | Relative strength over 12 bars: the stock’s move over 12 bars in units of its own ATR, minus SPY’s move in SPY’s ATR; slope over the last 5 readings Value: relative strength units per bar, default -0.05 Timeframes: 5m by default; add any chip Updates: Live on 5m, bar close on other chips |
| Relative strength slope (30 min) above value | The slope of the 30-minute relative strength (relative strength over the last 6 five-minute bars) is at or above your number. | Slope over the last 5 readings Value: relative strength units per bar, default 0.01 Timeframes: fixed, 5-minute Updates: Live |
| Relative strength slope (30 min) below value | The slope of the 30-minute relative strength is at or below your number. | Slope over the last 5 readings Value: relative strength units per bar, default -0.01 Timeframes: fixed, 5-minute Updates: Live |
| In a strong sector | The stock’s sector, weighted by market cap, is outperforming SPY by at least your number. Every stock in a sector shares the same score. | Built from each member’s 5-minute relative strength(12) Value: relative strength units, default 0.25 Timeframes: fixed, 5-minute Updates: with each watchlist build Left out: no sector on file |
| In a weak sector | The stock’s sector, weighted by market cap, is underperforming SPY by at least your number. Type it as a positive amount. | Built from each member’s 5-minute relative strength(12) Value: relative strength units, default 0.25 Timeframes: fixed, 5-minute Updates: with each watchlist build Left out: no sector on file |
Volume and Relative Volume
| Filter | What it checks | Settings and timing |
|---|---|---|
| Volume rising | Bar volume is trending up over the last 6 closed bars (a regression slope above 0). | Timeframes: 5m by default; add any chip Updates: Bar close Left out: fewer than 6 closed bars |
| Volume falling | Bar volume is trending down over the last 6 closed bars (a regression slope below 0). | Timeframes: 5m by default; add any chip Updates: Bar close Left out: fewer than 6 closed bars |
| Relative Volume falling | Relative volume is trending down. | 5m: today’s volume against normal for this time of day, slope over the last 10 readings Chips: each of the last 6 bars’ volume against its 20-bar average Timeframes: 5m by default; add any chip Updates: each 5-minute calculation on 5m, bar close on other chips |
| High relative volume in the last 3 bars | At least one of the last 3 closed bars traded at least your number times its average volume (the 20 bars before it). On the Daily chip that means the last 3 days. | Value: times average volume, default 2 Timeframes: 5m by default; add any chip Updates: Bar close Left out: fewer than 23 closed bars |
| High relative volume in the last 5 bars | At least one of the last 5 closed bars traded at least your number times its average volume (the 20 bars before it). | Value: times average volume, default 2 Timeframes: 5m by default; add any chip Updates: Bar close Left out: fewer than 25 closed bars |
| High relative volume in the last 10 bars | At least one of the last 10 closed bars traded at least your number times its average volume (the 20 bars before it). | Value: times average volume, default 2 Timeframes: 5m by default; add any chip Updates: Bar close Left out: fewer than 30 closed bars |
| High relative volume in the last 20 bars | At least one of the last 20 closed bars traded at least your number times its average volume (the 20 bars before it). | Value: times average volume, default 2 Timeframes: 5m by default; add any chip Updates: Bar close Left out: fewer than 40 closed bars |
| Relative Volume (RVol) | Volume so far today is at least your number times normal for this time of day. | Today’s volume against the average volume up to the same time over the last 20 days Value: times average volume, default 1.25 Timeframes: fixed, intraday Updates: Live, about every minute |
| Relative Volume/SPY (RRVol) | The stock’s relative volume divided by SPY’s relative volume is at least your number. | Both are the time-of-day relative volume used by Relative Volume (relative volume) Value: times SPY’s relative volume, default 1.25 Timeframes: fixed, intraday Updates: Live Left out: no relative volume data |
| Relative Volume rising | Relative volume is trending up. | 5m: today’s volume against normal for this time of day, slope over the last 10 readings Chips: each of the last 6 bars’ volume against its 20-bar average Timeframes: 5m by default; add any chip Updates: each 5-minute calculation on 5m, bar close on other chips |
| Relative Volume slope above value | The slope of the 5-minute relative volume over its last 10 readings is at or above your number. | Value: relative volume per bar, default 0.01 Timeframes: fixed, 5-minute Updates: each 5-minute calculation |
| High Relative Volume yesterday | Yesterday’s volume was more than 1.25 times its 50-day average (20-day for stocks with less history). | Timeframes: fixed, Daily Updates: Daily Left out: 20 days of history or less |
| Minimum volume today | Shares traded so far today are at least your number. | Value: millions of shares, default 0.5 Timeframes: none (a stock-level value) Updates: Live Left out: no volume today |
| Minimum average volume | Average daily volume over the last 50 completed sessions is at least your number. Today is not included. | Value: millions of shares, default 1 Timeframes: none (a stock-level value) Updates: Daily Left out: no daily bars |
| Volume fill | Today’s volume so far is at least this percent of the 50-day average daily volume. | Value: percent, default 85 Timeframes: none (a stock-level value) Updates: Live Left out: no volume today or no average volume |
Options & Options Levels
Distance to Levels
| Filter | What it checks | Settings and timing |
|---|---|---|
| Major GEX level above | The next major options gamma (GEX) level above the price is at least this percent away, so there is room to run up to it. | Levels: up to 15 strikes with the largest net gamma exposure (GEX), from the nightly options run Value: percent, default 3 Timeframes: none (uses the current price) Updates: Live; levels refresh nightly Left out: no options data, or price above the highest level |
| Major GEX level below | The next major GEX level below the price is at least this percent away, so there is room to fall to it. | Levels: up to 15 strikes with the largest net gamma exposure (GEX), from the nightly options run Value: percent, default 3 Timeframes: none (uses the current price) Updates: Live; levels refresh nightly Left out: no options data, or price below the lowest level |
Bounces & Rejections
| Filter | What it checks | Settings and timing |
|---|---|---|
| Bullish bounce off GEX level | One of the last 3 bars dipped into a major GEX level with its lower wick and closed back above it, and price is still above the level. | Within 0.15% of the level; the wick is at least 30% of the bar’s range; the forming bar counts Timeframes: Daily by default; add any chip Updates: Live; levels refresh nightly Left out: no options data |
| Bearish reject off GEX level | One of the last 3 bars poked up into a major GEX level with its upper wick and closed back below it, and price is still below the level. | Within 0.15% of the level; the wick is at least 30% of the bar’s range; the forming bar counts Timeframes: Daily by default; add any chip Updates: Live; levels refresh nightly Left out: no options data |
Options data
| Filter | What it checks | Settings and timing |
|---|---|---|
| Has Weekly Options | The stock has weekly options. | Timeframes: none (a stock-level value) Updates: Daily |
| Call % | Calls make up at least this percent of the options delta exposure (DEX) at strikes above the current price. | Value: percent, default 60 Timeframes: none (a stock-level value) Updates: Daily, after the nightly options run Left out: no options data |
| Put % | Puts make up at least this percent of the options delta exposure (DEX) at strikes above the current price. | Value: percent, default 60 Timeframes: none (a stock-level value) Updates: Daily, after the nightly options run Left out: no options data |
Trend & Momentum
Trend & Momentum
| Filter | What it checks | Settings and timing |
|---|---|---|
| Strong trend up (ADX) | A strong trend pointing up: ADX(14) is above 35 and +DI is above -DI. | ADX 14, Wilder smoothing Timeframes: 5m by default; add any chip Updates: Live on 5m, bar close on other chips Left out: fewer than 28 bars on 5m (26 on other chips) |
| Strong trend down (ADX) | A strong trend pointing down: ADX(14) is above 35 and -DI is above +DI. | ADX 14, Wilder smoothing Timeframes: 5m by default; add any chip Updates: Live on 5m, bar close on other chips Left out: fewer than 28 bars on 5m (26 on other chips) |
| ADX above value | ADX(14) on the 5-minute chart is at or above your number, in either direction. | Value: default 35 Timeframes: fixed, 5-minute Updates: Live Left out: fewer than 28 five-minute bars |
| Strong daily chart | The last three daily candles each closed at or above their open, and on the last completed day the 3 EMA was above the 8 EMA with the close above the 8 EMA. | Timeframes: fixed, Daily Updates: Daily Left out: fewer than 3 daily candles |
| Weak daily chart | The last three daily candles each closed below their open, and on the last completed day the 3 EMA was below the 8 EMA with the close below the 8 EMA. | Timeframes: fixed, Daily Updates: Daily Left out: fewer than 3 daily candles |
RSI & LRSI
| Filter | What it checks | Settings and timing |
|---|---|---|
| LRSI slope above value | The slope of the Laguerre RSI over its last 6 values is at or above your number. 0 means flat or rising. | Laguerre RSI, gamma 0.5, scale 0 to 1; the Daily chip reads gamma 0.7 as of the last completed day Value: LRSI units per bar, default 0.05 Timeframes: 5m by default; add any chip Updates: Live on 5m, bar close on other chips |
| LRSI slope below value | The slope of the Laguerre RSI over its last 6 values is at or below your number. 0 means flat or falling. | Laguerre RSI, gamma 0.5, scale 0 to 1; the Daily chip reads gamma 0.7 as of the last completed day Value: LRSI units per bar, default -0.05 Timeframes: 5m by default; add any chip Updates: Live on 5m, bar close on other chips |
| RSI above value | RSI(14) is at or above your number. | RSI 14, Wilder smoothing, forming bar included Value: default 70 Timeframes: 5m by default; add any chip Updates: Live Left out: fewer than 15 bars |
| RSI below value | RSI(14) is at or below your number. | RSI 14, Wilder smoothing, forming bar included Value: default 30 Timeframes: 5m by default; add any chip Updates: Live Left out: fewer than 15 bars, or no RSI yet |
| LRSI – strong trend | The Laguerre RSI is at or above 0.80, a strong bullish reading. | Laguerre RSI, gamma 0.5, scale 0 to 1; the Daily chip reads gamma 0.7 as of the last completed day Timeframes: 5m by default; add any chip Updates: Live on 5m, bar close on other chips |
| LRSI – weak trend | The Laguerre RSI is at or below 0.20, a strong bearish reading. | Laguerre RSI, gamma 0.5, scale 0 to 1; the Daily chip reads gamma 0.7 as of the last completed day Timeframes: 5m by default; add any chip Updates: Live on 5m, bar close on other chips |
| LRSI is above value | The Laguerre RSI is at or above your number, on a 0 to 1 scale where 0.80 is strong. | Laguerre RSI, gamma 0.5, scale 0 to 1; the Daily chip reads gamma 0.7 as of the last completed day Value: 0 to 1, default 0.15 Timeframes: 5m by default; add any chip Updates: Live on 5m, bar close on other chips |
| LRSI is below value | The Laguerre RSI is at or below your number, on a 0 to 1 scale where 0.20 is weak. | Laguerre RSI, gamma 0.5, scale 0 to 1; the Daily chip reads gamma 0.7 as of the last completed day Value: 0 to 1, default 0.85 Timeframes: 5m by default; add any chip Updates: Live on 5m, bar close on other chips |
| LRSI slope up | The Laguerre RSI is rising, or pinned at the top (1). | Laguerre RSI, gamma 0.5, scale 0 to 1; the Daily chip reads gamma 0.7 as of the last completed day; slope over the last 6 values Timeframes: 5m by default; add any chip Updates: Live on 5m, bar close on other chips |
| LRSI slope down | The Laguerre RSI is falling, or pinned at the bottom (0). | Laguerre RSI, gamma 0.5, scale 0 to 1; the Daily chip reads gamma 0.7 as of the last completed day; slope over the last 6 values Timeframes: 5m by default; add any chip Updates: Live on 5m, bar close on other chips |
Bollinger Band
| Filter | What it checks | Settings and timing |
|---|---|---|
| Above upper Bollinger Band | The live price is above the upper Bollinger Band. | Bollinger 20, 2, taken from the last closed bar Timeframes: 5m by default; add any chip Updates: Live; the band moves at bar close Left out: fewer than 21 closed bars |
| Below lower Bollinger Band | The live price is below the lower Bollinger Band. | Bollinger 20, 2, taken from the last closed bar Timeframes: 5m by default; add any chip Updates: Live; the band moves at bar close Left out: fewer than 21 closed bars |
| Bollinger Band width increasing | The Bollinger Band width (upper minus lower, divided by the middle) is widening: its slope over the last 6 bars is above 0. | 5m: Bollinger 5, 2, forming bar included; other chips: Bollinger 20, 2 on closed bars Timeframes: 5m by default; add any chip Updates: Live on 5m, bar close on other chips Left out: fewer than about 10 bars on 5m (21 on other chips) |
Stochastic
| Filter | What it checks | Settings and timing |
|---|---|---|
| Stochastic above value | Stochastic %K is at or above your number. | Stochastic 14, 3, 3: %K smoothed by a 3-bar SMA, %D = 3-bar SMA of %K; reads %K Value: default 50 Timeframes: 5m by default; add any chip Updates: Live Left out: fewer than 20 bars |
| Stochastic below value | Stochastic %K is at or below your number. | Stochastic 14, 3, 3: %K smoothed by a 3-bar SMA, %D = 3-bar SMA of %K; reads %K Value: default 50 Timeframes: 5m by default; add any chip Updates: Live Left out: fewer than 20 bars |
| Stochastic overbought (80+) | Stochastic %K is 80 or higher. | Stochastic 14, 3, 3: %K smoothed by a 3-bar SMA, %D = 3-bar SMA of %K; reads %K Timeframes: 5m by default; add any chip Updates: Live Left out: fewer than 20 bars |
| Stochastic oversold (20-) | Stochastic %K is 20 or lower. | Stochastic 14, 3, 3: %K smoothed by a 3-bar SMA, %D = 3-bar SMA of %K; reads %K Timeframes: 5m by default; add any chip Updates: Live Left out: fewer than 20 bars |
| Stochastic above signal line | Bullish: Stochastic %K is above its %D signal line. | Stochastic 14, 3, 3: %K smoothed by a 3-bar SMA, %D = 3-bar SMA of %K Timeframes: 5m by default; add any chip Updates: Live Left out: fewer than 20 bars |
| Stochastic below signal line | Bearish: Stochastic %K is below its %D signal line. | Stochastic 14, 3, 3: %K smoothed by a 3-bar SMA, %D = 3-bar SMA of %K Timeframes: 5m by default; add any chip Updates: Live Left out: fewer than 20 bars |
| Slow Stochastic 34/10/3 signal above value | The Slow Stochastic signal line is at or above your number. | Slow Stochastic 34, 10, 3, MetaTrader build: slowing 3, signal = 10-period EMA of the main line; reads the signal line Value: default 80 Timeframes: 5m by default; add any chip Updates: Bar close Left out: fewer than 47 closed bars |
| Slow Stochastic 34/10/3 signal below value | The Slow Stochastic signal line is at or below your number. | Slow Stochastic 34, 10, 3, MetaTrader build: slowing 3, signal = 10-period EMA of the main line; reads the signal line Value: default 20 Timeframes: 5m by default; add any chip Updates: Bar close Left out: fewer than 47 closed bars |
| Slow Stochastic 34/10/3 above its signal | Bullish: the Slow Stochastic main line is above its signal line. | Slow Stochastic 34, 10, 3, MetaTrader build: slowing 3, signal = 10-period EMA of the main line Timeframes: 5m by default; add any chip Updates: Bar close Left out: fewer than 47 closed bars |
| Slow Stochastic 34/10/3 below its signal | Bearish: the Slow Stochastic main line is below its signal line. | Slow Stochastic 34, 10, 3, MetaTrader build: slowing 3, signal = 10-period EMA of the main line Timeframes: 5m by default; add any chip Updates: Bar close Left out: fewer than 47 closed bars |
MACD
| Filter | What it checks | Settings and timing |
|---|---|---|
| MACD above zero | The MACD line is above zero. This is the MACD line itself, not the histogram. | MACD 12, 26, 9, forming bar included Timeframes: 5m by default; add any chip Updates: Live Left out: fewer than 35 bars |
| MACD below zero | The MACD line is below zero. This is the MACD line itself, not the histogram. | MACD 12, 26, 9, forming bar included Timeframes: 5m by default; add any chip Updates: Live Left out: fewer than 35 bars |
| Recent MACD cross up | The MACD line crossed above its signal line within the last N closed bars (0 = the bar that just closed). | MACD 12, 26, 9; looks back up to 100 bars Value: bars, default 3 Timeframes: 5m by default; add any chip Updates: Bar close |
| Recent MACD cross down | The MACD line crossed below its signal line within the last N closed bars (0 = the bar that just closed). | MACD 12, 26, 9; looks back up to 100 bars Value: bars, default 3 Timeframes: 5m by default; add any chip Updates: Bar close |
ZenBot Custom Indicators
Trade Signals (New)
| Filter | What it checks | Settings and timing |
|---|---|---|
| Trade Signal: buy signal on | The chart’s Trade Signals show an open Buy on that timeframe right now. | 15m and faster: the pullback engine (a dip in a stock that is already moving, then a turn; entries 9:45 to 15:55 ET; exit on a 1.5 ATR bracket or at 15:55) Slower than 15m: the trend engine, Buys only Timeframes: 5m by default; add any chip Updates: Bar close Left out: average bar dollar volume under $4M (15m and faster) |
| Trade Signal: short signal on | The chart’s Trade Signals show an open Short on that timeframe right now. Shorts only exist on 5m, 10m and 15m. | 15m and faster: the pullback engine (a dip in a stock that is already moving, then a turn; entries 9:45 to 15:55 ET; exit on a 1.5 ATR bracket or at 15:55) Timeframes: 5m by default; 10m or 15m chips Updates: Bar close Left out: average bar dollar volume under $4M |
| Trade Signal: new buy (bars) | A Buy fired within the last N closed bars and is still on (0 = the bar that just closed). | 15m and faster: the pullback engine (a dip in a stock that is already moving, then a turn; entries 9:45 to 15:55 ET; exit on a 1.5 ATR bracket or at 15:55) Slower than 15m: the trend engine, Buys only Value: bars, default 3 Timeframes: 5m by default; add any chip from 5m up Updates: Bar close |
| Trade Signal: new short (bars) | A Short fired within the last N closed bars and is still on (0 = the bar that just closed). | 15m and faster: the pullback engine (a dip in a stock that is already moving, then a turn; entries 9:45 to 15:55 ET; exit on a 1.5 ATR bracket or at 15:55) Value: bars, default 3 Timeframes: 5m by default; 10m or 15m chips Updates: Bar close |
ZenTrend
| Filter | What it checks | Settings and timing |
|---|---|---|
| ZenTrend Bull Cycle | ZenTrend is in a bull cycle: the fast line is above the slow line, as the chart draws it. | Fast line = slope of the last 20 closes; slow line = slope of the last 25 closes Timeframes: 5m by default; add any chip Updates: Live on 5m, bar close on other chips Left out: fewer than 25 bars |
| ZenTrend Bear Cycle | ZenTrend is in a bear cycle: the fast line is below the slow line, as the chart draws it. | Fast line = slope of the last 20 closes; slow line = slope of the last 25 closes Timeframes: 5m by default; add any chip Updates: Live on 5m, bar close on other chips Left out: fewer than 25 bars |
| ZenTrend turning up | ZenTrend’s fast line is above the slow line. Right now this finds the same stocks as ZenTrend Bull Cycle. | Fast line = slope of the last 20 closes; slow line = slope of the last 25 closes Timeframes: 5m by default; add any chip Updates: Bar close Left out: fewer than 25 closed bars |
| ZenTrend turning down | ZenTrend’s fast line is below the slow line. Right now this finds the same stocks as ZenTrend Bear Cycle. | Fast line = slope of the last 20 closes; slow line = slope of the last 25 closes Timeframes: 5m by default; add any chip Updates: Bar close Left out: fewer than 25 closed bars |
Trend Buying Signals (Legacy)
| Filter | What it checks | Settings and timing |
|---|---|---|
| Trend Buying Signal (ADX + VWAP) | On 5m: +DI is at least 20 with -DI under 20 and the two at least 5 apart, VWAP is rising (slope 0.01 or more) and price is above VWAP. | ADX 14 A timeframe chip checks only that VWAP is rising on that timeframe Timeframes: 5m by default; chips from 1m to 1h Updates: Live on 5m, bar close on other chips Left out: fewer than 28 five-minute bars |
| Trend Selling Signal (ADX + VWAP) | On 5m: -DI is at least 20 with +DI under 20 and the two at least 5 apart, VWAP is falling (slope -0.01 or less) and price is below VWAP. | ADX 14 A timeframe chip checks only that VWAP is falling on that timeframe Timeframes: 5m by default; chips from 1m to 1h Updates: Live on 5m, bar close on other chips Left out: fewer than 28 five-minute bars |
Patterns
Gaps
| Filter | What it checks | Settings and timing |
|---|---|---|
| Gap up from yesterday | Today opened at least 2% (of yesterday’s close) above yesterday’s high, a full gap over yesterday’s range. | Today’s open = the 9:30 open; before the open, the latest pre-market price Timeframes: fixed, Daily Updates: Live until the open, then fixed for the day Left out: no prior day |
| Recent gap up | A full gap up of at least 2% over the prior day’s high happened in the last 10 sessions, today included. | Timeframes: fixed, Daily Updates: Daily Left out: fewer than 2 daily candles |
| Gap down from yesterday | Today opened at least 2% (of yesterday’s close) below yesterday’s low, a full gap under yesterday’s range. | Today’s open = the 9:30 open; before the open, the latest pre-market price Timeframes: fixed, Daily Updates: Live until the open, then fixed for the day Left out: no prior day |
| Recent gap down | A full gap down of at least 2% under the prior day’s low happened in the last 10 sessions, today included. | Timeframes: fixed, Daily Updates: Daily Left out: fewer than 2 daily candles |
| Near a gap | Price is just outside an unfilled daily gap: within 0.5% above its top or below its bottom. | A gap = a day whose whole range sits at least 1% beyond the prior day’s high or low; later candles that trade into it shrink it, and 2 cents or less left counts as filled Price = the last closed 5-minute close Timeframes: fixed, daily gaps Updates: Bar close (5m) Left out: stocks under $5 |
| In a gap | Price is inside an unfilled daily gap. | A gap = a day whose whole range sits at least 1% beyond the prior day’s high or low; later candles that trade into it shrink it, and 2 cents or less left counts as filled Price = the last closed 5-minute close Timeframes: fixed, daily gaps Updates: Bar close (5m) Left out: stocks under $5 |
| In or near a gap | Price is inside an unfilled daily gap or within 0.5% of one. | A gap = a day whose whole range sits at least 1% beyond the prior day’s high or low; later candles that trade into it shrink it, and 2 cents or less left counts as filled Price = the last closed 5-minute close Timeframes: fixed, daily gaps Updates: Bar close (5m) Left out: stocks under $5 |
Chart Patterns
| Filter | What it checks | Settings and timing |
|---|---|---|
| Consolidating | The TTM Squeeze is on: the Bollinger Bands (20, 2) sit inside the Keltner Channel (20, 1.5), so price is coiling. | Keltner ATR is 10 periods on 5m and 20 periods on other chips Timeframes: 5m by default; add any chip Updates: Bar close With other 5-minute pattern and Heiken Ashi filters also on, a stock needs to match only one of them Left out: fewer than 21 bars |
| Rising closes (3 bars) | Each of the last 3 closed bars closed at or above the close before it. Highs are not checked. | Timeframes: 5m by default; add any chip Updates: Bar close With other 5-minute pattern and Heiken Ashi filters also on, a stock needs to match only one of them Left out: fewer than 4 closed bars |
| Falling closes (3 bars) | Each of the last 3 closed bars closed at or below the close before it. Lows are not checked. | Timeframes: 5m by default; add any chip Updates: Bar close With other 5-minute pattern and Heiken Ashi filters also on, a stock needs to match only one of them Left out: fewer than 4 closed bars |
| VWAP hard rejection | Today a 5-minute close stretched at least 8% from VWAP, a later bar came back to within 0.3% of VWAP (or through it), and a later close got back to that first stretched close. Either direction. | Once it happens it stays on for the rest of the day; a stretch the other way starts it over; regular session only; rare by design Timeframes: fixed, 5-minute Updates: Bar close With other 5-minute pattern and Heiken Ashi filters also on, a stock needs to match only one of them |
| Bull Flag | A strong pole up, then a tight, shallow pause on lighter volume, with price at or above VWAP. | 5m: today’s regular-session bars; the pole is at least 2.5 times the day’s average bar range and 1.5% of price, topping 3 to 10 bars ago; the pullback keeps at least half the pole, the flag range is at most 40% of the pole, and no bar has taken out the pole high Other chips use a simpler rule: ADX(14) above 25 with +DI over -DI on any of the last 10 bars, TTM Squeeze on now, and relative strength vs SPY 0 or more Timeframes: 5m by default; add any chip Updates: Bar close With other 5-minute pattern and Heiken Ashi filters also on, a stock needs to match only one of them Left out: fewer than 5 session bars today on 5m (20 closed bars on other chips) |
| Bear Flag | A strong pole down, then a tight, shallow bounce on lighter volume, with price at or below VWAP. | 5m: today’s regular-session bars; the pole is at least 2.5 times the day’s average bar range and 1.5% of price, bottoming 3 to 10 bars ago; the bounce gives back at most half the pole, the flag range is at most 40% of the pole, and no bar has taken out the pole low Other chips use a simpler rule: ADX(14) above 25 with -DI over +DI on any of the last 10 bars, TTM Squeeze on now, and relative strength vs SPY 0 or less Timeframes: 5m by default; add any chip Updates: Bar close With other 5-minute pattern and Heiken Ashi filters also on, a stock needs to match only one of them Left out: fewer than 5 session bars today on 5m (20 closed bars on other chips) |
| Recent SMA break – Bullish | Price is now above the daily 50, 100 or 200 SMA after at least one of the last 5 daily closes was below it. | Price = the last closed 5-minute close Timeframes: fixed, daily SMAs Updates: Bar close (5m) With the other Recent SMA break filter also on, a stock needs to match only one of them Left out: stocks under $5, fewer than 5 daily candles |
| Compression Break – Long | The live price is at or above the average of the last 7 closed bars plus one standard deviation. | Timeframes: 5m by default; add any chip Updates: Live; the band moves at bar close Left out: fewer than 7 closed bars |
| Compression Break – Short | The live price is at or below the average of the last 7 closed bars minus one standard deviation. | Timeframes: 5m by default; add any chip Updates: Live; the band moves at bar close Left out: fewer than 7 closed bars |
| Recent SMA break – Bearish | Price is now below the daily 50, 100 or 200 SMA after at least one of the last 5 daily closes was above it. | Price = the last closed 5-minute close Timeframes: fixed, daily SMAs Updates: Bar close (5m) With the other Recent SMA break filter also on, a stock needs to match only one of them Left out: stocks under $5, fewer than 5 daily candles |
| Breakout day | Price is at or above yesterday’s average 5-minute close plus one standard deviation: above the bulk of yesterday’s trading, though it can still be under yesterday’s high. | Uses yesterday’s regular-hours 5-minute closes; price = the last closed 5-minute close Timeframes: fixed, yesterday vs today Updates: Bar close (5m) Left out: no 5-minute bars for yesterday |
| Breakdown day | Price is at or below yesterday’s average 5-minute close minus one standard deviation: below the bulk of yesterday’s trading, though it can still be over yesterday’s low. | Uses yesterday’s regular-hours 5-minute closes; price = the last closed 5-minute close Timeframes: fixed, yesterday vs today Updates: Bar close (5m) Left out: no 5-minute bars for yesterday |
| Range break – up | Price is at or above the average daily close of the last 7 sessions plus one standard deviation. No tight range is required first. | Price = the last closed 5-minute close Timeframes: fixed, Daily Updates: Bar close (5m) Left out: fewer than 7 daily candles |
| Range break – down | Price is at or below the average daily close of the last 7 sessions minus one standard deviation. No tight range is required first. | Price = the last closed 5-minute close Timeframes: fixed, Daily Updates: Bar close (5m) Left out: fewer than 7 daily candles |
| Opening range break – up | Price is above the opening range high: the high of the first three 5-minute bars (9:30 to 9:45 ET). | Price = the last closed 5-minute close Timeframes: fixed, 5-minute, today Updates: Bar close (5m), from about 9:45 ET Left out: stocks under $5 |
| Opening range break – down | Price is below the opening range low: the low of the first three 5-minute bars (9:30 to 9:45 ET). | Price = the last closed 5-minute close Timeframes: fixed, 5-minute, today Updates: Bar close (5m), from about 9:45 ET Left out: stocks under $5 |
Heiken Ashi
| Filter | What it checks | Settings and timing |
|---|---|---|
| Heiken Ashi Compression Break Bull | A bullish Heiken Ashi reversal bar with the Bollinger Band width back at 1% or more, after at least 3 of the bars before it were narrower than that. | Heiken Ashi close = the bar’s (open + high + low + close) / 4; Heiken Ashi open = midpoint of the previous bar’s open and close 5m: Bollinger 5, any 5-minute bar in the last 30 minutes; other chips: Bollinger 20, 2, the last closed bar only Timeframes: 5m by default; add any chip Updates: Bar close With other 5-minute pattern and Heiken Ashi filters also on, a stock needs to match only one of them |
| Heiken Ashi Compression Break Bear | A bearish Heiken Ashi reversal bar with the Bollinger Band width back at 1% or more, after at least 3 of the bars before it were narrower than that. | Heiken Ashi close = the bar’s (open + high + low + close) / 4; Heiken Ashi open = midpoint of the previous bar’s open and close 5m: Bollinger 5, any 5-minute bar in the last 30 minutes; other chips: Bollinger 20, 2, the last closed bar only Timeframes: 5m by default; add any chip Updates: Bar close With other 5-minute pattern and Heiken Ashi filters also on, a stock needs to match only one of them |
| Heiken Ashi Reversal – Bull (within 30 min) | On 5m, a bullish Heiken Ashi reversal (the prior Heiken Ashi candle red, this one green with a bigger body and its low above the prior candle’s midpoint) printed on a bar that started in the last 30 minutes. | Heiken Ashi close = the bar’s (open + high + low + close) / 4; Heiken Ashi open = midpoint of the previous bar’s open and close Other chips: a reversal on that timeframe’s last closed bar Timeframes: 5m by default; add any chip Updates: Bar close With other 5-minute pattern and Heiken Ashi filters also on, a stock needs to match only one of them |
| Bars since Heiken Ashi Reversal – Bull | A bullish Heiken Ashi reversal happened within the last N closed bars (0 = the bar that just closed). | Heiken Ashi close = the bar’s (open + high + low + close) / 4; Heiken Ashi open = midpoint of the previous bar’s open and close Looks back up to 100 bars Value: bars, default 3 Timeframes: 5m by default; add any chip Updates: Bar close With other 5-minute pattern and Heiken Ashi filters also on, a stock needs to match only one of them |
| Heiken Ashi Reversal – Bear (within 30 min) | On 5m, a bearish Heiken Ashi reversal (the prior Heiken Ashi candle green, this one red with a bigger body and its high below the prior candle’s midpoint) printed on a bar that started in the last 30 minutes. | Heiken Ashi close = the bar’s (open + high + low + close) / 4; Heiken Ashi open = midpoint of the previous bar’s open and close Other chips: a reversal on that timeframe’s last closed bar Timeframes: 5m by default; add any chip Updates: Bar close With other 5-minute pattern and Heiken Ashi filters also on, a stock needs to match only one of them |
| Bars since Heiken Ashi Reversal – Bear | A bearish Heiken Ashi reversal happened within the last N closed bars (0 = the bar that just closed). | Heiken Ashi close = the bar’s (open + high + low + close) / 4; Heiken Ashi open = midpoint of the previous bar’s open and close Looks back up to 100 bars Value: bars, default 3 Timeframes: 5m by default; add any chip Updates: Bar close With other 5-minute pattern and Heiken Ashi filters also on, a stock needs to match only one of them |
| Heiken Ashi Continuation – Bull (within 30 min) | A bullish Heiken Ashi continuation (two Heiken Ashi candles in a row with no lower wick) in the last 30 minutes: on one of the last 6 closed 5-minute bars or the current bar. | Heiken Ashi close = the bar’s (open + high + low + close) / 4; Heiken Ashi open = midpoint of the previous bar’s open and close Other chips: the last closed bar of that timeframe Timeframes: 5m by default; add any chip Updates: Live on 5m, bar close on other chips With other 5-minute pattern and Heiken Ashi filters also on, a stock needs to match only one of them |
| Bars since Heiken Ashi Continuation – Bull | A bullish Heiken Ashi continuation happened within the last N closed bars (0 = the bar that just closed). | Heiken Ashi close = the bar’s (open + high + low + close) / 4; Heiken Ashi open = midpoint of the previous bar’s open and close Looks back up to 100 bars Value: bars, default 3 Timeframes: 5m by default; add any chip Updates: Bar close With other 5-minute pattern and Heiken Ashi filters also on, a stock needs to match only one of them |
| Heiken Ashi Continuation – Bear (within 30 min) | A bearish Heiken Ashi continuation (two Heiken Ashi candles in a row with no upper wick) in the last 30 minutes: on one of the last 6 closed 5-minute bars or the current bar. | Heiken Ashi close = the bar’s (open + high + low + close) / 4; Heiken Ashi open = midpoint of the previous bar’s open and close Other chips: the last closed bar of that timeframe Timeframes: 5m by default; add any chip Updates: Live on 5m, bar close on other chips With other 5-minute pattern and Heiken Ashi filters also on, a stock needs to match only one of them |
| Bars since Heiken Ashi Continuation – Bear | A bearish Heiken Ashi continuation happened within the last N closed bars (0 = the bar that just closed). | Heiken Ashi close = the bar’s (open + high + low + close) / 4; Heiken Ashi open = midpoint of the previous bar’s open and close Looks back up to 100 bars Value: bars, default 3 Timeframes: 5m by default; add any chip Updates: Bar close With other 5-minute pattern and Heiken Ashi filters also on, a stock needs to match only one of them |
Candle Patterns
| Filter | What it checks | Settings and timing |
|---|---|---|
| Recent Bullish Key Bar | One of the last 5 closed bars was a bullish key bar: green, a range bigger than ATR(14), a close in the top 30% of the bar and volume above its 8-bar average. | Timeframes: 5m by default; add any chip Updates: Bar close Left out: fewer than 14 bars |
| Recent Bearish Key Bar | One of the last 5 closed bars was a bearish key bar: red, a range bigger than ATR(14), a close in the bottom 30% of the bar and volume above its 8-bar average. | Timeframes: 5m by default; add any chip Updates: Bar close Left out: fewer than 14 bars |
| Recent Bullish Wick | One of the last 5 candles had a long lower wick (at least 0.5 ATR) and a small upper wick (under 0.3 ATR), a sign buyers defended a low. | ATR 14 of the same chart Timeframes: Daily by default; add any chip Updates: Daily; bar close on intraday chips Left out: fewer than 14 bars |
| Recent Bearish Wick | One of the last 5 candles had a long upper wick (at least 0.5 ATR) and a small lower wick (under 0.3 ATR), a sign sellers rejected a high. | ATR 14 of the same chart Timeframes: Daily by default; add any chip Updates: Daily; bar close on intraday chips Left out: fewer than 14 bars |
| Candle size increasing | Each of the last 3 closed bars has a bigger range (high minus low) than the one before it. | Timeframes: 5m by default; add any chip Updates: Bar close Left out: fewer than 4 closed bars |
| Candle size decreasing | Each of the last 3 closed bars has a smaller range (high minus low) than the one before it. | Timeframes: 5m by default; add any chip Updates: Bar close Left out: fewer than 4 closed bars |
Trading Halts
| Filter | What it checks | Settings and timing |
|---|---|---|
| Halted now | Trading is halted right now (a limit up / limit down volatility pause, or news): no resume time yet, or it is still ahead. | From the Nasdaq Trader trade-halts feed, checked every 20 seconds Timeframes: none (a stock-level value) Updates: Live |
| Resumed from halt (within min) | Trading resumed after a halt within the last N minutes. | From the Nasdaq Trader trade-halts feed, checked every 20 seconds Value: minutes, default 15 Timeframes: none (a stock-level value) Updates: Live |
| Not halted | Leaves out stocks whose trading is halted right now. | From the Nasdaq Trader trade-halts feed, checked every 20 seconds Timeframes: none (a stock-level value) Updates: Live |
Price Pops
| Filter | What it checks | Settings and timing |
|---|---|---|
| Bullish pop (within min) | A sudden bullish price pop was detected within the last N minutes. After the open it must also be above yesterday’s close. | A pop = the latest 1-minute close moved at least 1% (price $40 and up), 1.5% ($20 to $40), 3% ($10 to $20) or 5% (under $10) from a recent 5-minute close, on steady volume Value: minutes, default 30 Timeframes: none (a stock-level value) Updates: Live, each minute |
| Bearish pop (within min) | A sudden bearish price drop was detected within the last N minutes. After the open it must also be below yesterday’s close. | A pop = the latest 1-minute close moved at least 1% (price $40 and up), 1.5% ($20 to $40), 3% ($10 to $20) or 5% (under $10) from a recent 5-minute close, on steady volume Value: minutes, default 30 Timeframes: none (a stock-level value) Updates: Live, each minute |
Price Levels
Price Change
| Filter | What it checks | Settings and timing |
|---|---|---|
| Price % increase today | Price is up at least this percent from yesterday’s close. | Yesterday = the last completed session (Friday’s on a Monday); extended-hours trades count toward price Value: percent, default 0.5 Timeframes: fixed, today Updates: Live Left out: no prior close |
| Price % decrease today | Price is down at least this percent from yesterday’s close. Type the size of the drop: 2 means down 2% or more (a negative number works too). | Yesterday = the last completed session (Friday’s on a Monday); extended-hours trades count toward price Value: percent, default -0.5 Timeframes: fixed, today Updates: Live Left out: no prior close |
| Price % increase yesterday | Yesterday’s close was up at least this percent from the close before it. Today’s price plays no part. | Value: percent, default 0.5 Timeframes: fixed, Daily Updates: Daily Left out: fewer than two prior daily bars |
| Price % decrease yesterday | Yesterday’s close was down at least this percent from the close before it. Type the size of the drop: 2 means down 2% or more. | Value: percent, default -0.5 Timeframes: fixed, Daily Updates: Daily Left out: fewer than two prior daily bars |
| Price % move yesterday (either way) | Yesterday’s close-to-close move was at least this percent, up or down. | Value: percent, default 15 Timeframes: fixed, Daily Updates: Daily Left out: fewer than two prior daily bars |
| Price $ increase today | Price is up at least this many dollars from yesterday’s close. | Yesterday = the last completed session (Friday’s on a Monday); extended-hours trades count toward price Value: dollars, default 0.5 Timeframes: fixed, today Updates: Live Left out: no prior close |
| Price $ decrease today | Price is down at least this many dollars from yesterday’s close. Type the size of the drop: 2 means down $2 or more. | Yesterday = the last completed session (Friday’s on a Monday); extended-hours trades count toward price Value: dollars, default -0.5 Timeframes: fixed, today Updates: Live Left out: no prior close |
| Bar % Up | The current, still-forming bar is up at least this percent from the prior bar’s close. 3% on 5m catches fast risers. | Extended hours included Value: percent, default 3; each chip can carry its own value Timeframes: 5m by default; add any chip Updates: Live; starts over when a new bar opens |
| Bar % Down | The current, still-forming bar is down at least this percent from the prior bar’s close. | Extended hours included Value: percent, default 3 (type it positive) Timeframes: 5m by default; add any chip Updates: Live; starts over when a new bar opens |
VWAP
| Filter | What it checks | Settings and timing |
|---|---|---|
| Near VWAP (within %) | Price is within this percent of VWAP, above or below. | Session VWAP from 4:00 ET, pre-market included Value: percent, default 1 Timeframes: fixed, today Updates: Live Left out: no VWAP yet |
| Low of day below VWAP (at least %) | Today’s low reached at least this percent below the current VWAP. | Session VWAP from 4:00 ET, pre-market included; High and low of day are regular session only (9:30 to 16:00 ET) Value: percent, default 1.5 Timeframes: fixed, today Updates: Live Left out: before the open, or no VWAP yet |
| High of day above VWAP (at least %) | Today’s high reached at least this percent above the current VWAP. | Session VWAP from 4:00 ET, pre-market included; High and low of day are regular session only (9:30 to 16:00 ET) Value: percent, default 1.5 Timeframes: fixed, today Updates: Live Left out: before the open, or no VWAP yet |
| VWAP slope rising | The VWAP line is rising over the last 30 minutes. | Regression slope of 1-minute VWAP; Slope in raw dollars per bar, not scaled to price Timeframes: fixed, today Updates: Bar close (5m) Left out: fewer than 10 minutes of VWAP |
| VWAP slope falling | The VWAP line is falling over the last 30 minutes. | Regression slope of 1-minute VWAP; Slope in raw dollars per bar, not scaled to price Timeframes: fixed, today Updates: Bar close (5m) Left out: fewer than 10 minutes of VWAP |
| VWAP slope above value | The VWAP slope is at or above your number: the last 30 minutes of VWAP on the default 5m, or the last 6 bars of that timeframe’s VWAP on a chip. | Slope in raw dollars per bar, not scaled to price Value: dollars per bar, default 0.05; 0 means flat or rising Timeframes: 5m by default; chips need 6 session bars today, so 2h and longer never fill Updates: Bar close |
| VWAP slope rising (1 hour) | The VWAP line is rising over the last hour. | Regression slope of 1-minute VWAP; Slope in raw dollars per bar, not scaled to price Timeframes: fixed, today Updates: Bar close (5m) Left out: fewer than 12 minutes of VWAP |
| VWAP slope falling (1 hour) | The VWAP line is falling over the last hour. | Regression slope of 1-minute VWAP; Slope in raw dollars per bar, not scaled to price Timeframes: fixed, today Updates: Bar close (5m) Left out: fewer than 12 minutes of VWAP |
| VWAP slope below value | The VWAP slope is at or below your number: the last 30 minutes of VWAP on the default 5m, or the last 6 bars of that timeframe’s VWAP on a chip. | Slope in raw dollars per bar, not scaled to price Value: dollars per bar, default -0.05; 0 means flat or falling Timeframes: 5m by default; chips need 6 session bars today, so 2h and longer never fill Updates: Bar close |
| VWAP Bounce – Bullish | Today a 5-minute close stretched at least 8% above VWAP, a later bar’s low came within 0.3% of VWAP (or through it), and a later close got back up to that first stretched close. | Once it happens it stays on for the rest of the day; a stretch the other way starts it over; regular session only; rare by design Timeframes: fixed, 5-minute Updates: Bar close |
| VWAP Bounce – Bearish | Today a 5-minute close stretched at least 8% below VWAP, a later bar’s high came within 0.3% of VWAP (or through it), and a later close got back down to that first stretched close. | Once it happens it stays on for the rest of the day; a stretch the other way starts it over; regular session only; rare by design Timeframes: fixed, 5-minute Updates: Bar close |
| Above VWAP | Price is above today’s VWAP. | Session VWAP from 4:00 ET, pre-market included Timeframes: fixed, today Updates: Live Left out: no VWAP yet |
| Below VWAP | Price is below today’s VWAP. | Session VWAP from 4:00 ET, pre-market included Timeframes: fixed, today Updates: Live Left out: no VWAP yet |
| Strong VWAP slope up | VWAP is rising at least half a cent per minute over the last 30 minutes. That is a fixed dollar amount, so low-priced stocks reach it less easily than high-priced ones. | Timeframes: fixed, today Updates: Bar close (5m) Left out: no VWAP slope yet |
| Strong VWAP slope down | VWAP is falling at least half a cent per minute over the last 30 minutes. That is a fixed dollar amount, so low-priced stocks reach it less easily than high-priced ones. | Timeframes: fixed, today Updates: Bar close (5m) Left out: no VWAP slope yet |
AVWAP (Anchored VWAP)
| Filter | What it checks | Settings and timing |
|---|---|---|
| Above earnings AVWAP | Price is above the earnings AVWAP. | AVWAP built from daily bars, typical price weighted by volume, from the anchor day to now Anchor: the last earnings report whose session has started; an after-close report anchors the next weekday Timeframes: fixed, daily AVWAP vs live price Updates: Live; the AVWAP level updates daily Left out: no past report on file, or fewer than 5 daily bars |
| Near earnings AVWAP (within %) | Price is within this percent of the earnings AVWAP, above or below. | AVWAP built from daily bars, typical price weighted by volume, from the anchor day to now Anchor: the last earnings report whose session has started; an after-close report anchors the next weekday Value: percent of the AVWAP, default 1; 0 switches it off Timeframes: fixed, daily AVWAP vs live price Updates: Live; the AVWAP level updates daily Left out: no past report on file, or fewer than 5 daily bars |
| Below earnings AVWAP | Price is at or below the earnings AVWAP. | AVWAP built from daily bars, typical price weighted by volume, from the anchor day to now Anchor: the last earnings report whose session has started; an after-close report anchors the next weekday Timeframes: fixed, daily AVWAP vs live price Updates: Live; the AVWAP level updates daily Left out: no past report on file, or fewer than 5 daily bars |
| Above prior earnings AVWAP | Price is above the prior earnings AVWAP. | AVWAP built from daily bars, typical price weighted by volume, from the anchor day to now Anchor: the earnings report before the last one (an after-close report anchors the next weekday); if none is on file, 91 days before the last report Timeframes: fixed, daily AVWAP vs live price Updates: Live; the AVWAP level updates daily Left out: no past report on file, or fewer than 5 daily bars |
| Near prior earnings AVWAP (within %) | Price is within this percent of the prior earnings AVWAP, above or below. | AVWAP built from daily bars, typical price weighted by volume, from the anchor day to now Anchor: the earnings report before the last one (an after-close report anchors the next weekday); if none is on file, 91 days before the last report Value: percent of the AVWAP, default 1; 0 switches it off Timeframes: fixed, daily AVWAP vs live price Updates: Live; the AVWAP level updates daily Left out: no past report on file, or fewer than 5 daily bars |
| Below prior earnings AVWAP | Price is at or below the prior earnings AVWAP. | AVWAP built from daily bars, typical price weighted by volume, from the anchor day to now Anchor: the earnings report before the last one (an after-close report anchors the next weekday); if none is on file, 91 days before the last report Timeframes: fixed, daily AVWAP vs live price Updates: Live; the AVWAP level updates daily Left out: no past report on file, or fewer than 5 daily bars |
| Above quarter AVWAP | Price is above the quarter AVWAP. | AVWAP built from daily bars, typical price weighted by volume, from the anchor day to now Anchor: the first day of the calendar quarter (Jan 1, Apr 1, Jul 1, Oct 1) Timeframes: fixed, daily AVWAP vs live price Updates: Live; the AVWAP level updates daily Left out: fewer than 5 daily bars, or no daily bar yet this quarter |
| Near quarter AVWAP (within %) | Price is within this percent of the quarter AVWAP, above or below. | AVWAP built from daily bars, typical price weighted by volume, from the anchor day to now Anchor: the first day of the calendar quarter (Jan 1, Apr 1, Jul 1, Oct 1) Value: percent of the AVWAP, default 1; 0 switches it off Timeframes: fixed, daily AVWAP vs live price Updates: Live; the AVWAP level updates daily Left out: fewer than 5 daily bars, or no daily bar yet this quarter |
| Below quarter AVWAP | Price is at or below the quarter AVWAP. | AVWAP built from daily bars, typical price weighted by volume, from the anchor day to now Anchor: the first day of the calendar quarter (Jan 1, Apr 1, Jul 1, Oct 1) Timeframes: fixed, daily AVWAP vs live price Updates: Live; the AVWAP level updates daily Left out: fewer than 5 daily bars, or no daily bar yet this quarter |
| Above yearly AVWAP | Price is above the yearly AVWAP. | AVWAP built from daily bars, typical price weighted by volume, from the anchor day to now Anchor: Jan 1 of this year Timeframes: fixed, daily AVWAP vs live price Updates: Live; the AVWAP level updates daily Left out: fewer than 5 daily bars, or no daily bar yet this year |
| Near yearly AVWAP (within %) | Price is within this percent of the yearly AVWAP, above or below. | AVWAP built from daily bars, typical price weighted by volume, from the anchor day to now Anchor: Jan 1 of this year Value: percent of the AVWAP, default 1; 0 switches it off Timeframes: fixed, daily AVWAP vs live price Updates: Live; the AVWAP level updates daily Left out: fewer than 5 daily bars, or no daily bar yet this year |
| Below yearly AVWAP | Price is at or below the yearly AVWAP. | AVWAP built from daily bars, typical price weighted by volume, from the anchor day to now Anchor: Jan 1 of this year Timeframes: fixed, daily AVWAP vs live price Updates: Live; the AVWAP level updates daily Left out: fewer than 5 daily bars, or no daily bar yet this year |
| Above 52-week AVWAP | Price is above the 52-week AVWAP. | AVWAP built from daily bars, typical price weighted by volume, from the anchor day to now Anchor: 365 days ago, rolling Timeframes: fixed, daily AVWAP vs live price Updates: Live; the AVWAP level updates daily Left out: fewer than 5 daily bars |
| Near 52-week AVWAP (within %) | Price is within this percent of the 52-week AVWAP, above or below. | AVWAP built from daily bars, typical price weighted by volume, from the anchor day to now Anchor: 365 days ago, rolling Value: percent of the AVWAP, default 1; 0 switches it off Timeframes: fixed, daily AVWAP vs live price Updates: Live; the AVWAP level updates daily Left out: fewer than 5 daily bars |
| Below 52-week AVWAP | Price is at or below the 52-week AVWAP. | AVWAP built from daily bars, typical price weighted by volume, from the anchor day to now Anchor: 365 days ago, rolling Timeframes: fixed, daily AVWAP vs live price Updates: Live; the AVWAP level updates daily Left out: fewer than 5 daily bars |
Today
| Filter | What it checks | Settings and timing |
|---|---|---|
| Near high of day | Price is within 0.5% of today’s high. | High and low of day are regular session only (9:30 to 16:00 ET) Timeframes: fixed, today Updates: Live Left out: before the open |
| Near low of day | Price is within 0.5% of today’s low. | High and low of day are regular session only (9:30 to 16:00 ET) Timeframes: fixed, today Updates: Live Left out: before the open |
| Above pre-market high | Price is above today’s pre-market high (4:00 to 9:30 ET). | Cannot fire during pre-market itself Timeframes: fixed, today Updates: Live Left out: no pre-market trades today |
| Below pre-market low | Price is below today’s pre-market low (4:00 to 9:30 ET). | Cannot fire during pre-market itself Timeframes: fixed, today Updates: Live Left out: no pre-market trades today |
| Above today’s open | Price is above today’s 9:30 open. | Timeframes: fixed, today Updates: Live Left out: before the open |
| Below today’s open | Price is below today’s 9:30 open. | Timeframes: fixed, today Updates: Live Left out: before the open |
| Near high of day (within %) | Price is within this percent of today’s high. | High and low of day are regular session only (9:30 to 16:00 ET) Value: percent, default 1; 0 switches it off Timeframes: fixed, today Updates: Live Left out: before the open |
| Near high of day (within ATRs) | Price is within this many times the 5-minute ATR below today’s high. | High and low of day are regular session only (9:30 to 16:00 ET); ATR(14) on 5-minute bars Value: times ATR, default 1 Timeframes: fixed, today Updates: Live Left out: before the open |
| Off the high of day (at least %) | Price has pulled back more than this percent from today’s high. | High and low of day are regular session only (9:30 to 16:00 ET) Value: percent, default 1 Timeframes: fixed, today Updates: Live Left out: before the open |
| Near low of day (within %) | Price is within this percent of today’s low. | High and low of day are regular session only (9:30 to 16:00 ET) Value: percent, default 1; 0 switches it off Timeframes: fixed, today Updates: Live Left out: before the open |
| Near low of day (within ATRs) | Price is within this many times the 5-minute ATR above today’s low. | High and low of day are regular session only (9:30 to 16:00 ET); ATR(14) on 5-minute bars Value: times ATR, default 1 Timeframes: fixed, today Updates: Live Left out: before the open |
| Off the low of day (at least %) | Price has bounced more than this percent off today’s low. | High and low of day are regular session only (9:30 to 16:00 ET) Value: percent, default 1 Timeframes: fixed, today Updates: Live Left out: before the open |
| Near today’s open (within %) | Price is within this percent of today’s open, above or below. | Value: percent, default 1; 0 switches it off Timeframes: fixed, today Updates: Live Left out: before the open |
Yesterday
| Filter | What it checks | Settings and timing |
|---|---|---|
| Above yesterday’s range | Price is above yesterday’s high. Same test as Above yesterday’s high. | Yesterday = the last completed session (Friday’s on a Monday); extended-hours trades count toward price Timeframes: fixed, today Updates: Live Left out: no prior day |
| Below yesterday’s range | Price is below yesterday’s low. Same test as Below yesterday’s low. | Yesterday = the last completed session (Friday’s on a Monday); extended-hours trades count toward price Timeframes: fixed, today Updates: Live Left out: no prior day |
| Above yesterday’s high | Price is above yesterday’s high. | Yesterday = the last completed session (Friday’s on a Monday); extended-hours trades count toward price Timeframes: fixed, today Updates: Live Left out: no prior day |
| Below yesterday’s high | Price is below yesterday’s high. | Yesterday = the last completed session (Friday’s on a Monday); extended-hours trades count toward price Timeframes: fixed, today Updates: Live Left out: no prior day |
| Above yesterday’s low | Price is above yesterday’s low. | Yesterday = the last completed session (Friday’s on a Monday); extended-hours trades count toward price Timeframes: fixed, today Updates: Live Left out: no prior day |
| Below yesterday’s low | Price is below yesterday’s low. | Yesterday = the last completed session (Friday’s on a Monday); extended-hours trades count toward price Timeframes: fixed, today Updates: Live Left out: no prior day |
| Above yesterday’s close | Price is above yesterday’s close. | Yesterday = the last completed session (Friday’s on a Monday); extended-hours trades count toward price Timeframes: fixed, today Updates: Live Left out: no prior close |
| Below yesterday’s close | Price is below yesterday’s close. | Yesterday = the last completed session (Friday’s on a Monday); extended-hours trades count toward price Timeframes: fixed, today Updates: Live Left out: no prior close |
| Near yesterday’s close (within %) | Price is within this percent of yesterday’s close, above or below. | Yesterday = the last completed session (Friday’s on a Monday); extended-hours trades count toward price Value: percent, default 1; 0 switches it off Timeframes: fixed, today Updates: Live Left out: no prior day |
| Near yesterday’s high (within %) | Price is within this percent of yesterday’s high, above or below. | Yesterday = the last completed session (Friday’s on a Monday); extended-hours trades count toward price Value: percent, default 1; 0 switches it off Timeframes: fixed, today Updates: Live Left out: no prior day |
| Near yesterday’s low (within %) | Price is within this percent of yesterday’s low, above or below. | Yesterday = the last completed session (Friday’s on a Monday); extended-hours trades count toward price Value: percent, default 1; 0 switches it off Timeframes: fixed, today Updates: Live Left out: no prior day |
| Above prior day high | Price is above yesterday’s high. Same test as Above yesterday’s high. | Yesterday = the last completed session (Friday’s on a Monday); extended-hours trades count toward price Timeframes: fixed, today Updates: Live Left out: no prior day |
| Below prior day low | Price is below yesterday’s low. Same test as Below yesterday’s low. | Yesterday = the last completed session (Friday’s on a Monday); extended-hours trades count toward price Timeframes: fixed, today Updates: Live Left out: no prior day |
Highs & Lows
| Filter | What it checks | Settings and timing |
|---|---|---|
| Near high of year | Price is at, above or within 0.5% of the highest daily high of the last 12 months. | Price = the last closed 5-minute close, so it can trail the live price by up to one bar Timeframes: fixed, Daily Updates: Bar close (5m) Left out: stocks under $5 |
| Near low of year | Price is at, below or within 0.5% of the lowest daily low of the last 12 months. | Price = the last closed 5-minute close, so it can trail the live price by up to one bar Timeframes: fixed, Daily Updates: Bar close (5m) Left out: stocks under $5 |
| Near three-month high | Price is at, above or within 0.5% of the highest daily high of the last 3 months. | Price = the last closed 5-minute close, so it can trail the live price by up to one bar Timeframes: fixed, Daily Updates: Bar close (5m) Left out: stocks under $5 |
| Near three-month low | Price is at, below or within 0.5% of the lowest daily low of the last 3 months. | Price = the last closed 5-minute close, so it can trail the live price by up to one bar Timeframes: fixed, Daily Updates: Bar close (5m) Left out: stocks under $5 |
| Near monthly high | Price is at, above or within 0.5% of the highest daily high of the last month. | Price = the last closed 5-minute close, so it can trail the live price by up to one bar Timeframes: fixed, Daily Updates: Bar close (5m) Left out: stocks under $5 |
| Near monthly low | Price is at, below or within 0.5% of the lowest daily low of the last month. | Price = the last closed 5-minute close, so it can trail the live price by up to one bar Timeframes: fixed, Daily Updates: Bar close (5m) Left out: stocks under $5 |
| New 10-day high today | Today’s high is at or above every high of the prior 10 sessions. It stays on for the day even if price falls back. | High and low of day are regular session only (9:30 to 16:00 ET) Timeframes: fixed, Daily vs today Updates: Bar close (5m) Left out: stocks under $5, fewer than 10 prior daily bars, before the open |
| New 10-day low today | Today’s low is at or below every low of the prior 10 sessions. It stays on for the day even if price bounces. | High and low of day are regular session only (9:30 to 16:00 ET) Timeframes: fixed, Daily vs today Updates: Bar close (5m) Left out: stocks under $5, fewer than 10 prior daily bars, before the open |
| New 20-day high today | Today’s high is at or above every high of the prior 20 sessions. It stays on for the day even if price falls back. | High and low of day are regular session only (9:30 to 16:00 ET) Timeframes: fixed, Daily vs today Updates: Bar close (5m) Left out: stocks under $5, fewer than 20 prior daily bars, before the open |
| New 20-day low today | Today’s low is at or below every low of the prior 20 sessions. It stays on for the day even if price bounces. | High and low of day are regular session only (9:30 to 16:00 ET) Timeframes: fixed, Daily vs today Updates: Bar close (5m) Left out: stocks under $5, fewer than 20 prior daily bars, before the open |
Multi-Month Momentum
| Filter | What it checks | Settings and timing |
|---|---|---|
| Min 1-month change % | The live price is up at least this percent from the close about 21 trading days ago. Use a negative number for decliners. | Value: percent, default 25 Timeframes: fixed, Daily Updates: Live Left out: fewer than 22 daily bars |
| Max 1-month change % | The live price’s change from the close about 21 trading days ago is at most this percent. Use a negative number to find decliners. | Value: percent, default 0 Timeframes: fixed, Daily Updates: Live Left out: fewer than 22 daily bars |
| Min 3-month change % | The live price is up at least this percent from the close about 63 trading days ago. Use a negative number for decliners. | Value: percent, default 50 Timeframes: fixed, Daily Updates: Live Left out: fewer than 64 daily bars |
| Max 3-month change % | The live price’s change from the close about 63 trading days ago is at most this percent. Use a negative number to find decliners. | Value: percent, default 0 Timeframes: fixed, Daily Updates: Live Left out: fewer than 64 daily bars |
| Min 6-month change % | The live price is up at least this percent from the close about 126 trading days ago. Use a negative number for decliners. | Value: percent, default 100 Timeframes: fixed, Daily Updates: Live Left out: fewer than 127 daily bars |
| Max 6-month change % | The live price’s change from the close about 126 trading days ago is at most this percent. Use a negative number to find decliners. | Value: percent, default 0 Timeframes: fixed, Daily Updates: Live Left out: fewer than 127 daily bars |
Moving Averages & Volatility
50 SMA
| Filter | What it checks | Settings and timing |
|---|---|---|
| Near 50 SMA (within %) | The live price is within this percent of the 50 SMA, above or below. | Value: percent, default 1; 0 switches it off Timeframes: Daily by default; add any chip (5m included) Updates: Live Left out: fewer than 50 bars for the SMA |
| Above 50 SMA | The live price is above the 50 SMA. | Timeframes: Daily by default; add any chip (5m included) Updates: Live Left out: fewer than 50 bars for the SMA |
| Below 50 SMA | The live price is below the 50 SMA. | Timeframes: Daily by default; add any chip (5m included) Updates: Live Left out: fewer than 50 bars for the SMA |
| Bounced off 50 SMA (within bars) | Price tested the 50 SMA from above within the last N closed bars and is still above it now. | A test = a closed bar whose low came within 0.15 ATR(14) of the line, or dipped through it, but closed above it, after 3 closes above Value: bars, default 3 (0 = the bar that just closed) Timeframes: 5m by default; add any chip Updates: the test is found at bar close; the still-above or still-below check is live Left out: fewer than 50 closed bars |
| Rejected at 50 SMA (within bars) | Price tested the 50 SMA from below within the last N closed bars and is still below it now. | A test = a closed bar whose high came within 0.15 ATR(14) of the line, or poked through it, but closed below it, after 3 closes below Value: bars, default 3 (0 = the bar that just closed) Timeframes: 5m by default; add any chip Updates: the test is found at bar close; the still-above or still-below check is live Left out: fewer than 50 closed bars |
| Bounced off 50 SMA in an uptrend (within bars) | Same as Bounced off 50 SMA, and the trend agrees: the 50 SMA is above the 100 SMA on that timeframe right now. | A test = a closed bar whose low came within 0.15 ATR(14) of the line, or dipped through it, but closed above it, after 3 closes above Value: bars, default 3 (0 = the bar that just closed) Timeframes: 5m by default; add any chip Updates: the test is found at bar close; the still-above or still-below check is live Left out: fewer than 50 closed bars |
| Rejected at 50 SMA in a downtrend (within bars) | Same as Rejected at 50 SMA, and the trend agrees: the 50 SMA is below the 100 SMA on that timeframe right now. | A test = a closed bar whose high came within 0.15 ATR(14) of the line, or poked through it, but closed below it, after 3 closes below Value: bars, default 3 (0 = the bar that just closed) Timeframes: 5m by default; add any chip Updates: the test is found at bar close; the still-above or still-below check is live Left out: fewer than 50 closed bars |
100 SMA
| Filter | What it checks | Settings and timing |
|---|---|---|
| Near 100 SMA (within %) | The live price is within this percent of the 100 SMA, above or below. | Value: percent, default 1; 0 switches it off Timeframes: Daily by default; add any chip (5m included) Updates: Live Left out: fewer than 100 bars for the SMA |
| Above 100 SMA | The live price is above the 100 SMA. | Timeframes: Daily by default; add any chip (5m included) Updates: Live Left out: fewer than 100 bars for the SMA |
| Below 100 SMA | The live price is below the 100 SMA. | Timeframes: Daily by default; add any chip (5m included) Updates: Live Left out: fewer than 100 bars for the SMA |
| Bounced off 100 SMA (within bars) | Price tested the 100 SMA from above within the last N closed bars and is still above it now. | A test = a closed bar whose low came within 0.15 ATR(14) of the line, or dipped through it, but closed above it, after 3 closes above Value: bars, default 3 (0 = the bar that just closed) Timeframes: 5m by default; add any chip Updates: the test is found at bar close; the still-above or still-below check is live Left out: fewer than 100 closed bars |
| Rejected at 100 SMA (within bars) | Price tested the 100 SMA from below within the last N closed bars and is still below it now. | A test = a closed bar whose high came within 0.15 ATR(14) of the line, or poked through it, but closed below it, after 3 closes below Value: bars, default 3 (0 = the bar that just closed) Timeframes: 5m by default; add any chip Updates: the test is found at bar close; the still-above or still-below check is live Left out: fewer than 100 closed bars |
| Bounced off 100 SMA in an uptrend (within bars) | Same as Bounced off 100 SMA, and the trend agrees: price is above the 50 SMA on that timeframe right now. | A test = a closed bar whose low came within 0.15 ATR(14) of the line, or dipped through it, but closed above it, after 3 closes above Value: bars, default 3 (0 = the bar that just closed) Timeframes: 5m by default; add any chip Updates: the test is found at bar close; the still-above or still-below check is live Left out: fewer than 100 closed bars |
| Rejected at 100 SMA in a downtrend (within bars) | Same as Rejected at 100 SMA, and the trend agrees: price is below the 50 SMA on that timeframe right now. | A test = a closed bar whose high came within 0.15 ATR(14) of the line, or poked through it, but closed below it, after 3 closes below Value: bars, default 3 (0 = the bar that just closed) Timeframes: 5m by default; add any chip Updates: the test is found at bar close; the still-above or still-below check is live Left out: fewer than 100 closed bars |
200 SMA
| Filter | What it checks | Settings and timing |
|---|---|---|
| Near 200 SMA (within %) | The live price is within this percent of the 200 SMA, above or below. | Value: percent, default 1; 0 switches it off Timeframes: Daily by default; add any chip (5m included) Updates: Live Left out: fewer than 200 bars for the SMA |
| Above 200 SMA | The live price is above the 200 SMA. | Timeframes: Daily by default; add any chip (5m included) Updates: Live Left out: fewer than 200 bars for the SMA |
| Below 200 SMA | The live price is below the 200 SMA. | Timeframes: Daily by default; add any chip (5m included) Updates: Live Left out: fewer than 200 bars for the SMA |
| Bounced off 200 SMA (within bars) | Price tested the 200 SMA from above within the last N closed bars and is still above it now. | A test = a closed bar whose low came within 0.15 ATR(14) of the line, or dipped through it, but closed above it, after 3 closes above Fresh tests are found on the newest 2 closed bars and carried forward from there Value: bars, default 3 (0 = the bar that just closed) Timeframes: 5m by default; add any chip Updates: the test is found at bar close; the still-above or still-below check is live Left out: fewer than 200 closed bars |
| Rejected at 200 SMA (within bars) | Price tested the 200 SMA from below within the last N closed bars and is still below it now. | A test = a closed bar whose high came within 0.15 ATR(14) of the line, or poked through it, but closed below it, after 3 closes below Fresh tests are found on the newest 2 closed bars and carried forward from there Value: bars, default 3 (0 = the bar that just closed) Timeframes: 5m by default; add any chip Updates: the test is found at bar close; the still-above or still-below check is live Left out: fewer than 200 closed bars |
| Bounced off 200 SMA in an uptrend (within bars) | Same as Bounced off 200 SMA, and the trend agrees: price is above the 50 SMA on that timeframe right now. | A test = a closed bar whose low came within 0.15 ATR(14) of the line, or dipped through it, but closed above it, after 3 closes above Fresh tests are found on the newest 2 closed bars and carried forward from there Value: bars, default 3 (0 = the bar that just closed) Timeframes: 5m by default; add any chip Updates: the test is found at bar close; the still-above or still-below check is live Left out: fewer than 200 closed bars |
| Rejected at 200 SMA in a downtrend (within bars) | Same as Rejected at 200 SMA, and the trend agrees: price is below the 50 SMA on that timeframe right now. | A test = a closed bar whose high came within 0.15 ATR(14) of the line, or poked through it, but closed below it, after 3 closes below Fresh tests are found on the newest 2 closed bars and carried forward from there Value: bars, default 3 (0 = the bar that just closed) Timeframes: 5m by default; add any chip Updates: the test is found at bar close; the still-above or still-below check is live Left out: fewer than 200 closed bars |
SMA Alignment
| Filter | What it checks | Settings and timing |
|---|---|---|
| Daily SMA 50 > 100 > 200 | The daily 50 SMA is above the 100 SMA and the 100 is above the 200. All three must exist. | Timeframes: fixed, Daily Updates: Live (daily SMAs barely move during the day) Left out: fewer than 200 daily bars |
| Daily SMA 50 < 100 < 200 | The daily 50 SMA is below the 100 SMA and the 100 is below the 200. All three must exist. | Timeframes: fixed, Daily Updates: Live (daily SMAs barely move during the day) Left out: fewer than 200 daily bars |
| Between two daily SMAs | Price sits between the daily 50 and 100 SMAs, or between the daily 100 and 200 SMAs, in either order, and those two SMAs are within 3% of price of each other. | Timeframes: fixed, Daily Updates: Live Left out: a missing SMA (short history) |
| Near a major daily SMA | Price is within 2% of the daily 50, 100 or 200 SMA. | Price = the last closed 5-minute close; SMAs as of yesterday’s close Timeframes: fixed, daily SMAs Updates: Bar close (5m) An SMA that cannot be computed is ignored |
8 EMA
| Filter | What it checks | Settings and timing |
|---|---|---|
| Near 8 EMA (within %) | Price is within this percent of the 8 EMA, above or below. | Forming bar included Value: percent, default 1; 0 switches it off Timeframes: 5m by default; add any chip Updates: Live Left out: fewer than 9 bars |
| Bounced off 8 EMA (within bars) | Price tested the 8 EMA from above within the last N closed bars and is still above it now. | A test = a closed bar whose low came within 0.15 ATR(14) of the line, or dipped through it, but closed above it, after 3 closes above Value: bars, default 3 (0 = the bar that just closed) Timeframes: 5m by default; add any chip Updates: the test is found at bar close; the still-above or still-below check is live Left out: fewer than 12 closed bars |
| Rejected at 8 EMA (within bars) | Price tested the 8 EMA from below within the last N closed bars and is still below it now. | A test = a closed bar whose high came within 0.15 ATR(14) of the line, or poked through it, but closed below it, after 3 closes below Value: bars, default 3 (0 = the bar that just closed) Timeframes: 5m by default; add any chip Updates: the test is found at bar close; the still-above or still-below check is live Left out: fewer than 12 closed bars |
21 EMA
| Filter | What it checks | Settings and timing |
|---|---|---|
| Near 21 EMA (within %) | Price is within this percent of the 21 EMA, above or below. | Forming bar included Value: percent, default 1; 0 switches it off Timeframes: 5m by default; add any chip Updates: Live Left out: fewer than 22 bars |
| Bounced off 21 EMA (within bars) | Price tested the 21 EMA from above within the last N closed bars and is still above it now. | A test = a closed bar whose low came within 0.15 ATR(14) of the line, or dipped through it, but closed above it, after 3 closes above Value: bars, default 3 (0 = the bar that just closed) Timeframes: 5m by default; add any chip Updates: the test is found at bar close; the still-above or still-below check is live Left out: fewer than 25 closed bars |
| Rejected at 21 EMA (within bars) | Price tested the 21 EMA from below within the last N closed bars and is still below it now. | A test = a closed bar whose high came within 0.15 ATR(14) of the line, or poked through it, but closed below it, after 3 closes below Value: bars, default 3 (0 = the bar that just closed) Timeframes: 5m by default; add any chip Updates: the test is found at bar close; the still-above or still-below check is live Left out: fewer than 25 closed bars |
50 EMA
| Filter | What it checks | Settings and timing |
|---|---|---|
| Near 50 EMA (within %) | Price is within this percent of the 50 EMA, above or below. | Forming bar included Value: percent, default 1; 0 switches it off Timeframes: 5m by default; add any chip Updates: Live Left out: fewer than 50 bars |
| Bounced off 50 EMA (within bars) | Price tested the 50 EMA from above within the last N closed bars and is still above it now. | A test = a closed bar whose low came within 0.15 ATR(14) of the line, or dipped through it, but closed above it, after 3 closes above Value: bars, default 3 (0 = the bar that just closed) Timeframes: 5m by default; add any chip Updates: the test is found at bar close; the still-above or still-below check is live Left out: fewer than 54 closed bars |
| Rejected at 50 EMA (within bars) | Price tested the 50 EMA from below within the last N closed bars and is still below it now. | A test = a closed bar whose high came within 0.15 ATR(14) of the line, or poked through it, but closed below it, after 3 closes below Value: bars, default 3 (0 = the bar that just closed) Timeframes: 5m by default; add any chip Updates: the test is found at bar close; the still-above or still-below check is live Left out: fewer than 54 closed bars |
EMA Crosses & Trends
| Filter | What it checks | Settings and timing |
|---|---|---|
| Recent 3/8 EMA cross up | The 3 EMA crossed above the 8 EMA recently. | 5m: within the last 9 closed bars, and still crossed on the last one; other chips: on one of the last 4 closed bars (0 to 3 bars ago) Timeframes: 5m by default; add any chip Updates: Bar close |
| Recent 3/8 EMA cross down | The 3 EMA crossed below the 8 EMA recently. | 5m: within the last 9 closed bars, and still crossed on the last one; other chips: on one of the last 4 closed bars (0 to 3 bars ago) Timeframes: 5m by default; add any chip Updates: Bar close |
| 3-EMA above 8-EMA | The 3 EMA is above the 8 EMA right now. | Forming bar included Timeframes: 5m by default; add any chip Updates: Live Left out: fewer than 9 bars |
| 3-EMA below 8-EMA | The 3 EMA is below the 8 EMA right now. | Forming bar included Timeframes: 5m by default; add any chip Updates: Live Left out: fewer than 9 bars |
| Recent 8/21 EMA cross up | The 8 EMA crossed above the 21 EMA recently. | 5m: within the last 9 closed bars, and still crossed on the last one; other chips: on one of the last 4 closed bars (0 to 3 bars ago) Timeframes: 5m by default; add any chip Updates: Bar close |
| Recent 8/21 EMA cross down | The 8 EMA crossed below the 21 EMA recently. | 5m: within the last 9 closed bars, and still crossed on the last one; other chips: on one of the last 4 closed bars (0 to 3 bars ago) Timeframes: 5m by default; add any chip Updates: Bar close |
| 8-EMA above 21-EMA | The 8 EMA is above the 21 EMA right now. | Forming bar included Timeframes: 5m by default; add any chip Updates: Live Left out: fewer than 22 bars |
| 8-EMA below 21-EMA | The 8 EMA is below the 21 EMA right now. | Forming bar included Timeframes: 5m by default; add any chip Updates: Live Left out: fewer than 22 bars |
| EMA Power Angle – Bullish | The 21 EMA is rising more than $0.035 per bar and the 8 EMA more than $0.01 per bar. These are fixed dollar amounts, so higher-priced stocks reach them more easily. | Slopes = regression over the last 6 EMA values, in dollars per bar Timeframes: 5m by default; add any chip Updates: Live on 5m, bar close on other chips |
| EMA Power Angle – Bearish | The 21 EMA is falling more than $0.035 per bar and the 8 EMA more than $0.01 per bar. These are fixed dollar amounts, so higher-priced stocks reach them more easily. | Slopes = regression over the last 6 EMA values, in dollars per bar Timeframes: 5m by default; add any chip Updates: Live on 5m, bar close on other chips |
Volatility (ATR & ADR)
| Filter | What it checks | Settings and timing |
|---|---|---|
| Minimum ATR $ | The daily ATR(14), in dollars, is at or above your number. A timeframe chip uses that timeframe’s ATR(14) instead. | Value: dollars, default 0.20; 0 switches it off Timeframes: Daily by default; add any chip Updates: Daily; live on intraday chips Left out: fewer than 14 bars |
| Minimum ATR % | The daily ATR(14) is at least this percent of price. A timeframe chip uses that timeframe’s ATR(14) instead. | Value: percent of price, default 1.5; 0 switches it off Timeframes: Daily by default; add any chip Updates: Daily; live on intraday chips Left out: fewer than 14 bars |
| Minimum ADR % | The average daily range is at least this percent of the live price. | ADR = average of high minus low over the last 14 completed days, gaps ignored Value: percent, default 3 Timeframes: fixed, Daily Updates: Live (the range is fixed for the day) Left out: fewer than 14 daily bars |
| Minimum ADR $ | The average daily range, in dollars, is at least your number. | ADR = average of high minus low over the last 14 completed days, gaps ignored Value: dollars, default 0.20 Timeframes: fixed, Daily Updates: Daily Left out: fewer than 14 daily bars |
TTM Squeeze
| Filter | What it checks | Settings and timing |
|---|---|---|
| Bollinger Band width slope above value | The Bollinger Band width is rising at least this fast. | Width = (upper minus lower) / middle; slope over the last 6 widths; 5m uses Bollinger 5, 2 and other chips Bollinger 20, 2 Value: width units per bar, default 0.001; 0 means flat or widening Timeframes: 5m by default; add any chip Updates: Live on 5m, bar close on other chips |
| Bollinger Band width slope below value | The Bollinger Band width slope is at or below your number (a negative number means shrinking bands). | Width = (upper minus lower) / middle; slope over the last 6 widths; 5m uses Bollinger 5, 2 and other chips Bollinger 20, 2 Value: width units per bar, default -0.001; 0 means flat or shrinking Timeframes: 5m by default; add any chip Updates: Live on 5m, bar close on other chips |
| TTM Squeeze on | TTM Squeeze is on: the Bollinger Bands (20, 2) sit fully inside the Keltner Channel (20 EMA, 1.5 ATR). | Keltner ATR is 10 periods on 5m and 20 periods on other chips Timeframes: 5m by default; add any chip Updates: Live on 5m, bar close on other chips Left out: fewer than 21 bars |
| TTM Squeeze firing | The squeeze just released: it was on for the bar before and is off now. It does not tell you the breakout direction. | Keltner ATR is 10 periods on 5m and 20 periods on other chips Timeframes: 5m by default; add any chip Updates: Live on 5m (forming bar vs last closed bar), bar close on other chips Left out: fewer than 22 bars |
| TTM Squeeze fired recently | The squeeze released within the last N closed bars (0 = the bar that just closed). | Bollinger 20, 2 against Keltner 20, 1.5 over the last 60 closed bars Value: bars, default 3 Timeframes: 5m by default; add any chip Updates: Bar close Left out: fewer than 21 closed bars |