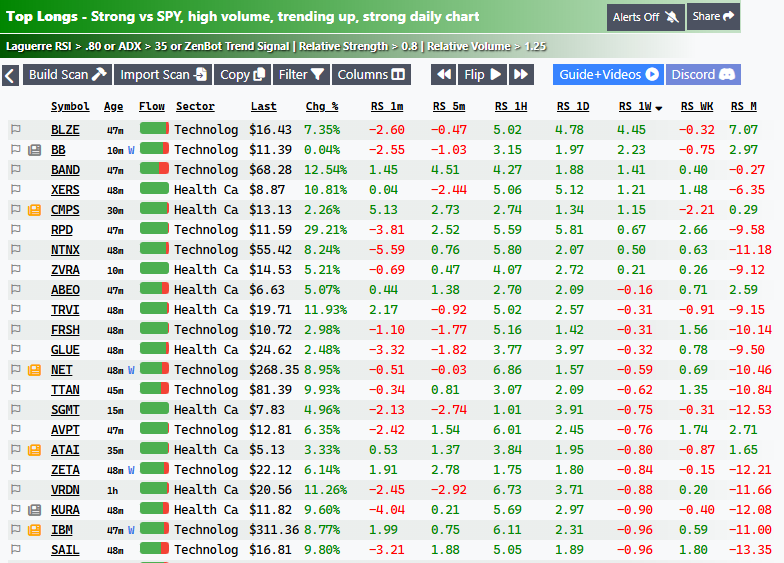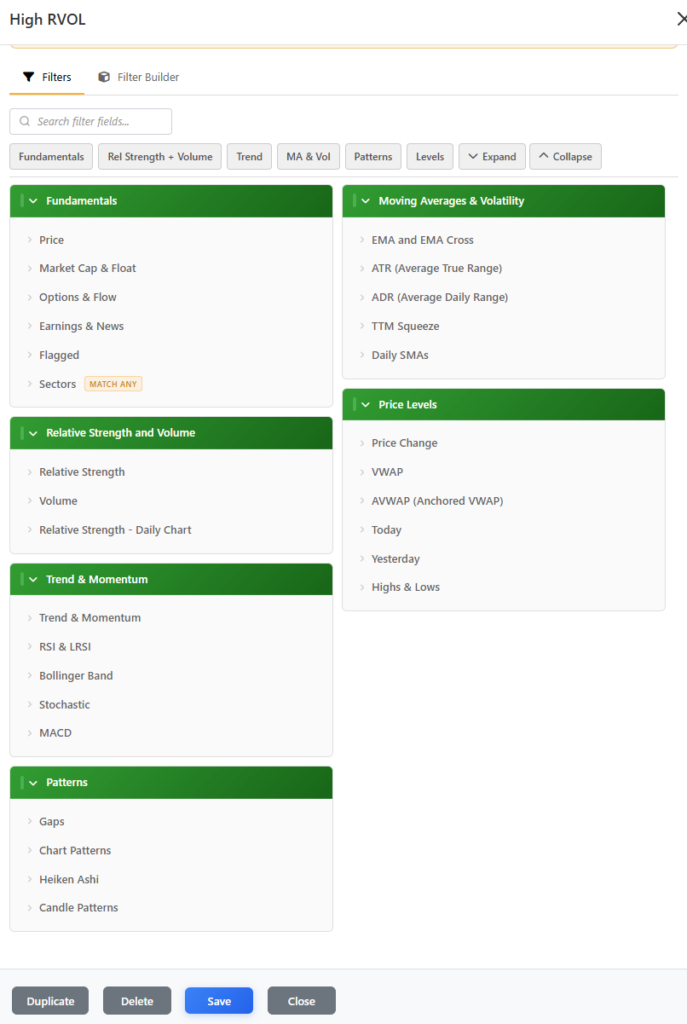
Big news – almost every filter and column in now works on any timeframe from 1-minute up to weekly! Here’s the tour.
Scan any timeframe
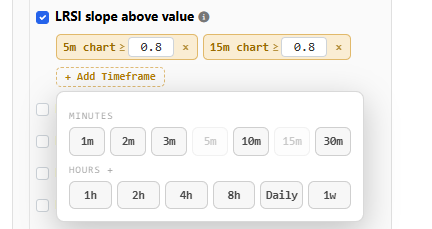
Until now, most filters answered one question: “is this happening on the 5-minute chart?” (plus a handful of daily-chart versions). Now, nearly every technical filter carries a timeframe selector. Open any filter and you’ll see an option to add the timeframes you care about, each with its own threshold:
- Ready to Break Out – Strong 15-minute trend with a 5-minute consolidation and rising 5-min volume.
- RSI below 30 on the 1-hour — find real pullbacks, not 5-minute noise
- TTM Squeeze firing on the 15-minute AND the Daily — multi-timeframe confluence in one scan
- Compression break on the 4-hour — setups that used to require staring at charts all day
Every timeframe chip is evaluated server-side against real bar data — 13 timeframes per ticker (1m, 2m, 3m, 5m, 10m, 15m, 30m, 1H, 2H, 4H, 8H, Daily, Weekly), updated continuously. Your alerts fire on them too — set an alert on a scan with timeframe filters and the engine evaluates the real thing, not an approximation.
You can even remove the 5-minute default from a filter — want a scan that’s purely about the hourly chart? Click the × on the 5m chip.
Your existing scans upgraded themselves
If you had daily-chart filters (Daily RSI, Daily Squeeze, D1 Compression Break, RS lookbacks like “RS 2 Hours”), they’ve been automatically migrated to the new system — same behavior, now expressed as the modern filter plus a timeframe chip. Your saved scans, thresholds, and alerts carry over untouched.
Multi-timeframe columns
The grid learned the same trick. The column picker now offers each indicator on any timeframe: add RSI 1H, Stoch 15m, RS 1D side by side and watch a setup develop across timeframes without leaving the scanner.