
Another month, another round of big upgrades! Besides the big new Multiple Timeframe Indicator update, there are a lot of new features and bug fixes
New Indicators
- Stochastic — by popular request. %K (“Stochastic”) and %D (“signal line”) as columns, plus filters: above/below a value, overbought (80+), oversold (20−), and above/below the signal line. All timeframe-capable from day one.
- Compression Break — Long / Short — the daily compression break you know, generalized: close breaking one standard deviation beyond the prior 7-bar range, on any timeframe.
- VWAP Bounce — Bullish / Bearish — the hard VWAP bounce detector is now directional, so you can scan for the long setup and the short setup separately.
- Relative Volume rising / falling — is participation building or fading, on the timeframe you trade.
Distance filters — “within X% of the level”
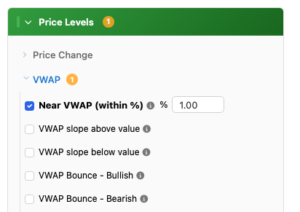
A new family of filters for traders who work levels: price within X% of VWAP, the 50/100/200 SMA, the 8/21/50 EMA (any timeframe), high/low of day, today’s open, or yesterday’s close/high/low. Great for pullback entries and level-watch scans.
Plus numeric slope filters (VWAP slope, RS slope, LRSI slope, BB-width slope above/below a value) for fine-grained trend work — each timeframe-capable.
A reorganized, faster filter experience
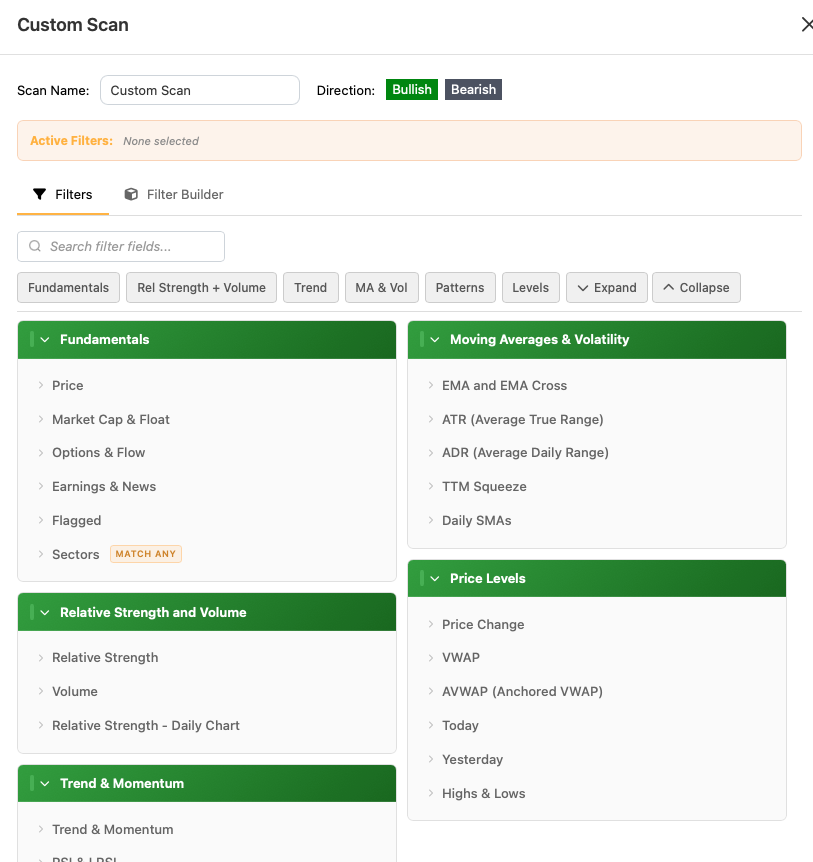
Filters and columns are regrouped into six concept groups — Fundamentals, Relative Strength + Volume, Trend & Momentum, Moving Averages & Volatility, Patterns, Price Levels — consistently across the Filters tab, the Filter Builder, and the column picker. One mental model everywhere.
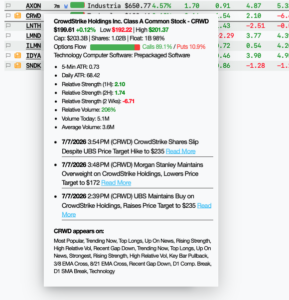
Hover any symbol in the grid for the full detail card — price, levels, key stats, options flow, news, and which scans it’s on — without clicking away.
The column and builder field pickers are now a browsable modal: category tabs, search, an inline timeframe dropdown on each field, clear headings, and a mobile-friendly layout.
Faster everywhere
This release rides on a week of performance work:
- Minute-fresh indicators. The scanner’s core 5-minute indicators used to fully refresh on 5-minute bar closes. A new incremental calculation engine now updates the forming bar’s entire indicator — so scans react to developing moves up to four minutes sooner, and alerts fire on the minute the condition becomes true, not the bar close after.
- Faster charts and daily views.
Appendix: the full bug-fix list
For those of you who read changelogs for fun — everything fixed in this release
Data accuracy
- Daily ATR was reading lower than reality for most symbols, and daily RSI, ADX, Choppiness, and ZenTrend daily readings were skewed
- Day change (% and $) could be measured against the wrong session — in some conditions “yesterday’s close” anchored to two sessions back, making every change figure wrong for the day.
- Change % could display as the full share price for symbols missing prior-day data — the missing-data case is now handled instead of dividing by nothing.
- RVOL could show absurd negative values for recently-listed symbols (21-49 days old) — a placeholder value was leaking into the average-volume math.
- After-hours prices could leak into high/low-of-day and VWAP calculations — session windows are now strictly bounded to regular trading hours.
- The 30-minute aggregate series was overwriting the 15-minute series in one calculation path — each timeframe now gets its own data.
- Parabolic SAR could show a fake “99” price when no signal existed, reading as an extreme signal on low-priced stocks — it now reads neutral.
As always: tell us what to build next in Discord. A lot of this release — stochastic, timeframe selection, the distance filters — came directly from your requests.