The right rail
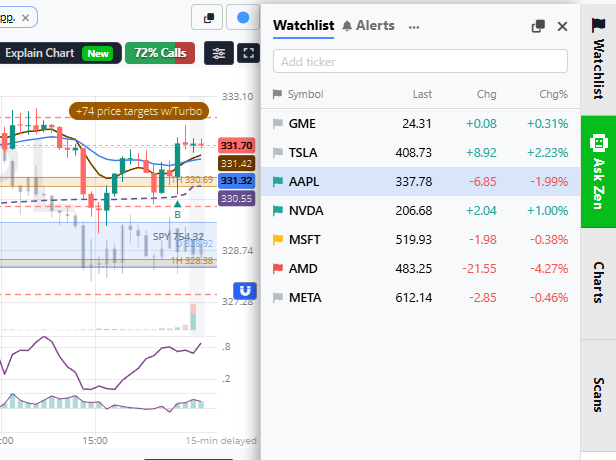
Down the right edge of the screen is a narrow rail with four tabs: Watchlist, Ask Zen, Charts and Scans. Click one to open its panel beside the rail, click it again to close it. A lit tab means its panel is open.
- Watchlist and Ask Zen share the space to the left of the rail: opening one closes the other.
- Charts shows or hides the chart column. The small chevron in the gutter between the scan and the charts hides them too.
- Scans shows or hides the scans menu on the left, on the pages that have one.
- The small chevron at the top of the rail folds the rail away and the charts take its room. A slim tab stays on the right edge; click it to bring the rail back.
Whether the Watchlist is open, whether the charts show, whether the scans menu is hidden and whether the rail is folded are remembered on this device, so a refresh brings the page back the way you left it. They are not synced between devices.
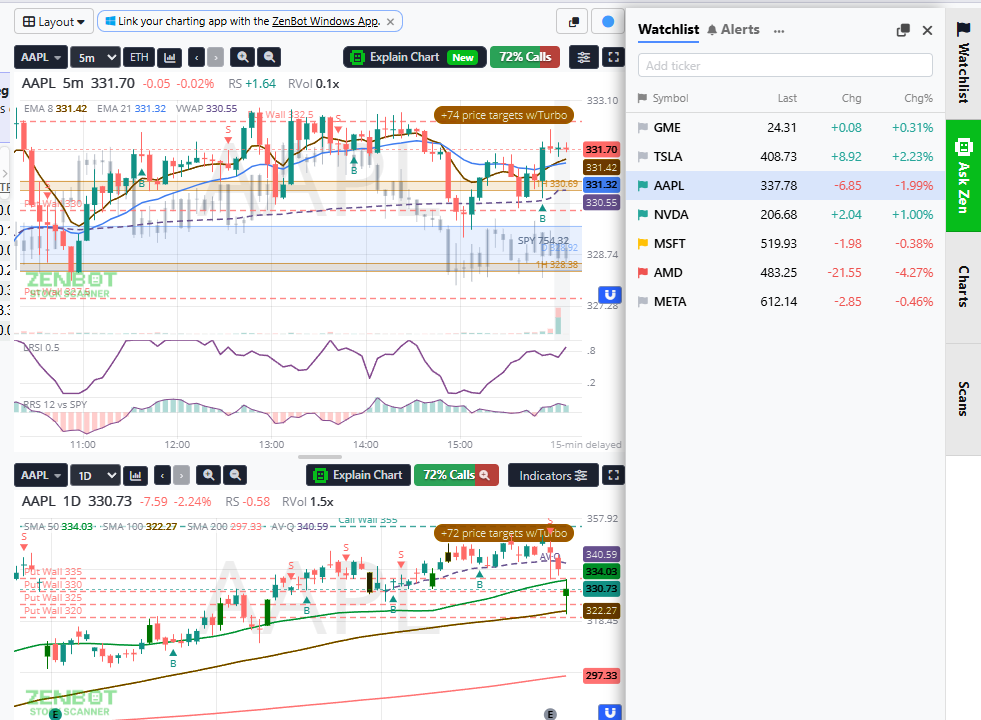
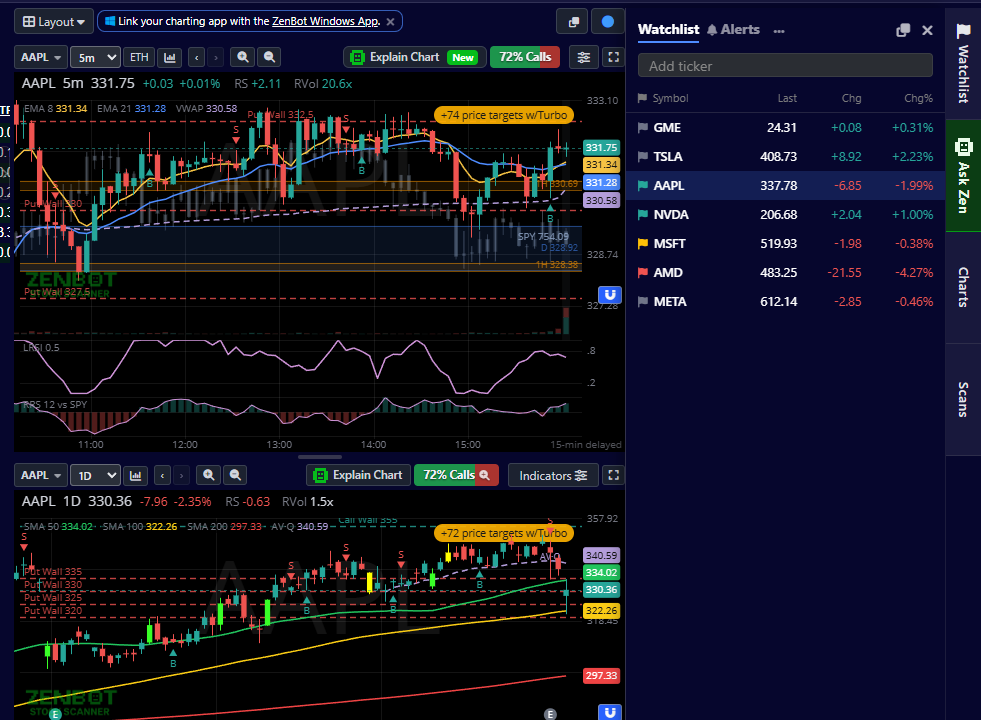
The Watchlist
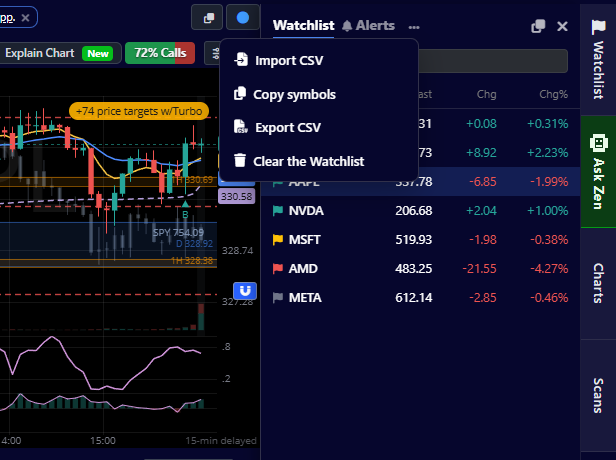
Your Watchlist is the stocks you keep an eye on. Each row shows the last price, the change and the percent change, and a click on a row charts it. A stock can be on the list with a green, yellow or red flag, or with no flag at all.
Adding stocks
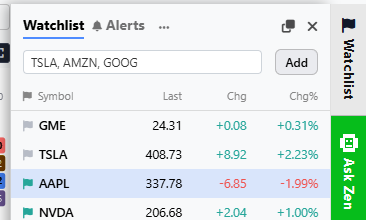
- Type a symbol in the Add ticker box and press Enter. It goes on the list with no flag. The box suggests symbols as you type: ↓ and ↑ walk the suggestions, Enter or a click adds the lit one. A small Add button appears beside the box once there is something to add.
- Paste a list. Commas, spaces or one symbol per line all work, and TradingView’s
NASDAQ:AAPLform is understood. Everything the scanner knows goes on in one go; a note tells you what was already on the list and what it does not know. - Flag a stock anywhere in the app: the flag at the start of a scan row, a right-click on a row or chart, or the flag on a stock’s card in the search box. Flagged stocks are on the Watchlist too.
Adding a stock that is already on the list does nothing to it: its row lights up for a moment so you can see where it is, and its flag stays.
New rows go to the bottom of the list. Drag rows to reorder them, or click a column heading to sort by symbol, flag color, price or change; a third click on the heading goes back to your own order.
Flags
Click the flag at the start of a row to change it: Green, Yellow, Red, No flag (the stock stays on the list), or Remove from Watchlist. The same choices are on every stock’s right-click menu.
| Color | Use it for | Key on a scan row |
|---|---|---|
| Green | A long candidate | 1 |
| Red | A short candidate | 2 |
| Yellow | Seen it, come back later | 3 |
| No flag | On the list, no opinion yet | – |
Keyboard
Click a row, then ↑ and ↓ move through the list and chart each stock as you go. While the Watchlist has your attention the arrow keys leave the scan alone; click anywhere in the scan to hand them back.
The list’s menu
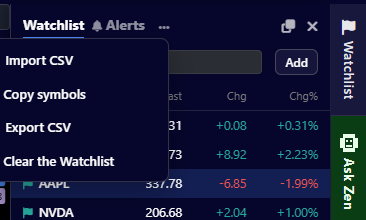
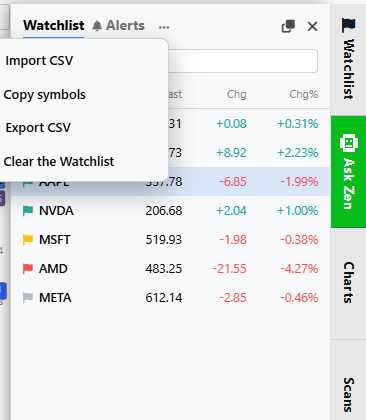
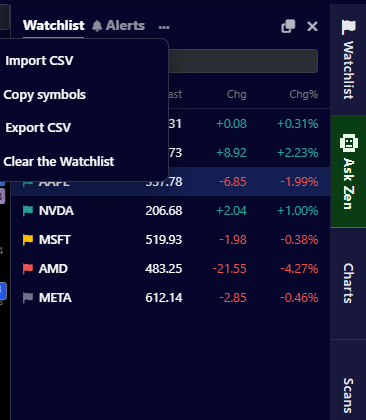
The three dots in the Watchlist header hold:
- Import CSV: a CSV or text file. The symbol comes from a Symbol or Ticker column, or the first column when there is no header, and a Flag column is honored, so a file you exported comes back with its colors.
- Copy symbols: the list onto the clipboard, comma separated, ready for another app.
- Export CSV: a file with symbol, flag, last, change and change percent as shown.
- Clear the Watchlist: every stock and flag off the list, after a confirmation. Alerts on those stocks are not touched.
The Watchlist as a scan
Watchlist near the top of the scans menu opens the whole list as a scan, with every column, filter and chart the other scans have. Flagged and unflagged stocks are all there. On Multi-Scan the scan picker in each panel has the Watchlist pinned at the top, then your Favorites, then the rest.
Alerts in the Watchlist
The Alerts tab at the top of the panel lists your scan alerts and stock alerts with their state, and a Log of what fired. Alerts on a single stock, a price crossing a level and the like, have their own section on the Alerts page: Stock alerts.